We’re familiar with the notion that a director’s success often hinges on their selection of characters in a movie. Yet, what types of characters do accomplished directors gravitate towards? How varied are directors in their choices of characters? Can we identify highly successful directors who consistently lean towards specific character types, and conversely, those who exhibit a broad spectrum in their character selections? Moreover, does the choice of characters significantly influence a movie’s success? This section aims to delve into these questions and uncover the intricate connections between directors’ character choices and the ultimate success of both the directors and their films.
Exploring Character Choices of Successful Directors
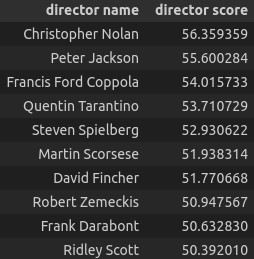
To understand the character preferences of successful directors, we’ll start by examining the top 10 directors in our dataset.
These directors are widely recognized in the industry. Moving on, we’ll take a closer look at the score distribution of directors.
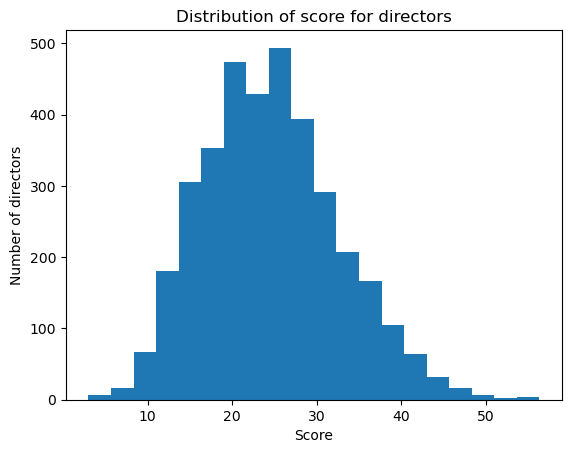
The director scores are centered around 20-30, indicating a distribution that follows the normal distribution pattern, with the highest frequency occurring around the average.
Now, let’s delve into the distribution of character types chosen by all directors.

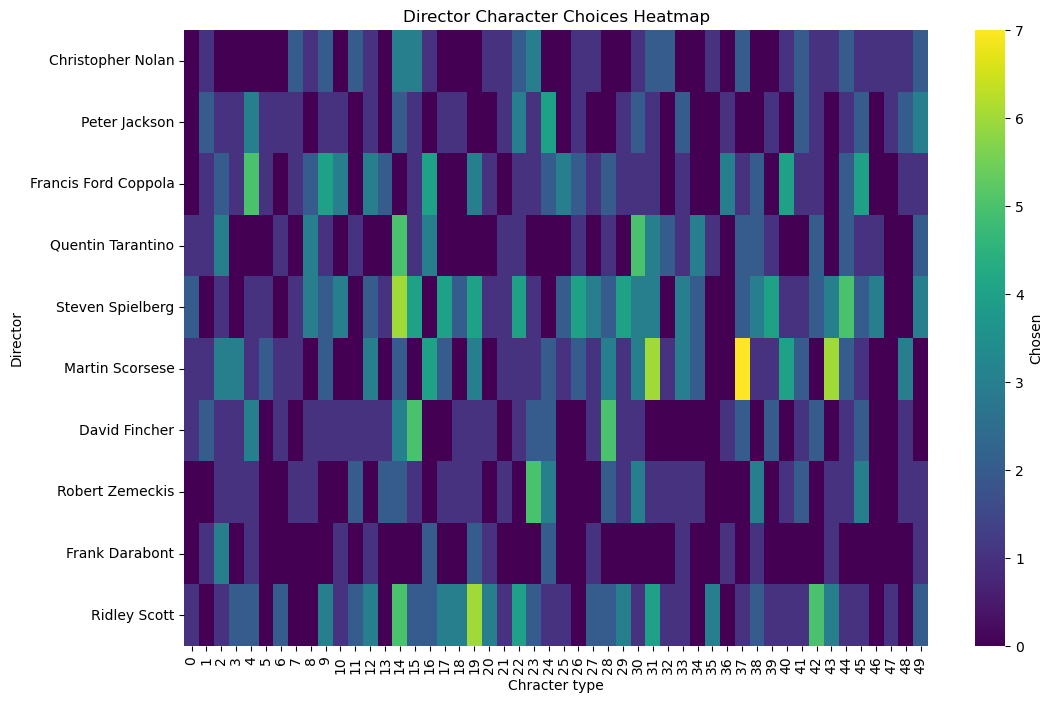
What are the choise for the top 10 directors?
It appears that they all make diverse character choices. Let’s examine this more closely. The top 5 topics among the top 10 directors are 14, 31, 19, 30, and 15. Now, let’s explore the words corresponding to each topic.
| Chracter types | Words |
|---|---|
| 14 | tell take find leave try give visit admit agree return |
| 31 | see ask tell find go refuse leave get give try |
| 19 | officer hire general detective david major assign film artist pilot |
| 30 | wife girl plan befriend member martin wound ex expose minister |
| 15 | john professor perform rao consider guy intervene transform count dump |
And the distribution of all character types among the top 10 directors.
Based on the information above, it is evident that character type 14 is the most commonly chosen among all top 10 directors. Nonetheless, the character choices vary significantly among these directors.
Director Diversity in Character Choices
From above, seems like success directers have a diverse choice of chracters. But let us explore more about the diversity if the directors choices of chracters. First, let see the distrubutin of the directers by the number of unique chracters he/she workded with.
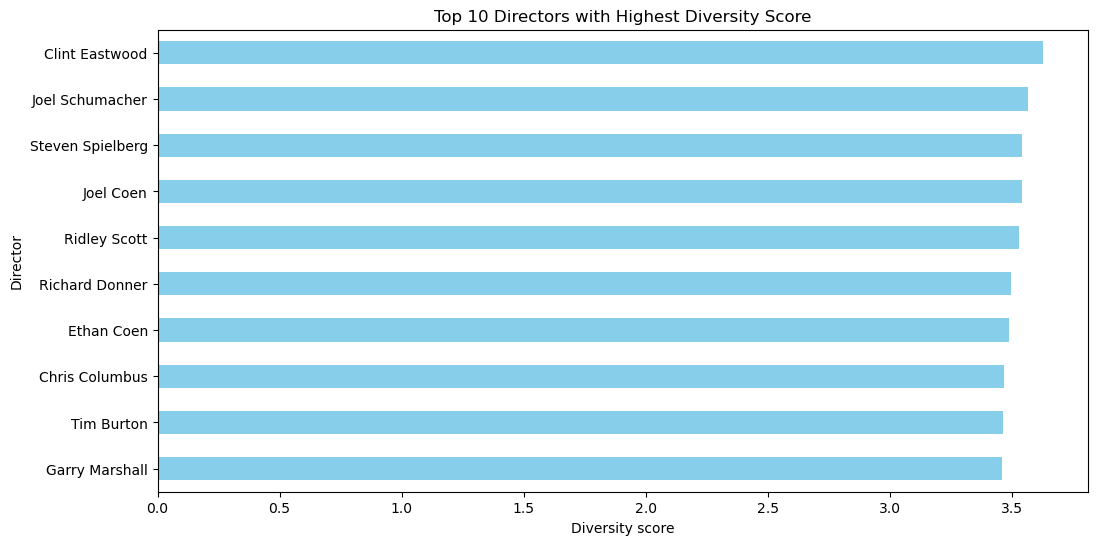
Let’s have a close look of ten directors with the highest diversity.
From the above pie chart, we can observe that almost half of the directors only worked with one or two chractor type. However, using this method to define the diversity of directors’ chatacter choices might be subject to the influence of the total number of movies each director has undertaken. To achieve a more precise quantification of the diversity in directors’ character choices, we need a more refined quantitative method.
For quantify diversity, we calculate the Shannon diversity index with normalization for each director based on the distribution of chracter types in their movies. Higher entropy values indicate grater diversity.
Based on the information presented in the pie chart, it is evident that 32.6% of directors exhibit a diversity score falling within the 1-2 range. Additionally, 31.6% of directors possess a diversity score of 0, indicating that their works predominantly feature a single character type. It’s worth noting that this might be influenced by the limitations of the plot data available from CMU, as not all movies and characters have sufficient information to determine character types accurately. In the 0-1 range, 20.1% of directors fall into this category, while 13.8% fall within the 2-3 range. Notably, only 1.9% of directors attain a score of 3-4, indicating a higher diversity of character types in their works.
Success Directors: Consistent vs. Diverse Character Choices
Now, let’s establish a connection between director success and the diversity of character choices. Let’s begin by examining the diversity score of the top 10 successful directors.
Similarly, among the top 10 successful directors, 9 fall within the highest range of diversity scores. How about the top 20?
And when considering more?
Here, we notice that as more top successful directors are included, the distribution of high diversity scores decreases. This prompts the question: is there a correlation between the diversity of character types and the success of directors? Let’s do an analysis.
Let’s examine some key findings derived from the analysis. Firstly, the coefficient for diversity_score is 5.3351, indicating that with each unit increase in the diversity score, we anticipate an approximate 5.33-point rise in the director score. Essentially, this implies a positive correlation between the director score and the diversity score. Secondly, the p-value associated with the coefficient is <0.05. This indicates that, within the framework of this model, the coefficients are statistically significant, signifying that the diversity score is indeed valuable in predicting the director score.
The Impact on the Movie’s Success
How character choices influence the success of movies is our focus here. Let’s delve into exploring and understanding this relationship. To start, we’ll examine the average movie score associated with each character type.
In the above plot, we can see that the scores for different types of characters are quite similar. Therefore, there isn’t a specific character type with a significantly higher movie score. However, let’s delve deeper to investigate whether there is a relationship between the movie score and the character type for each directors.
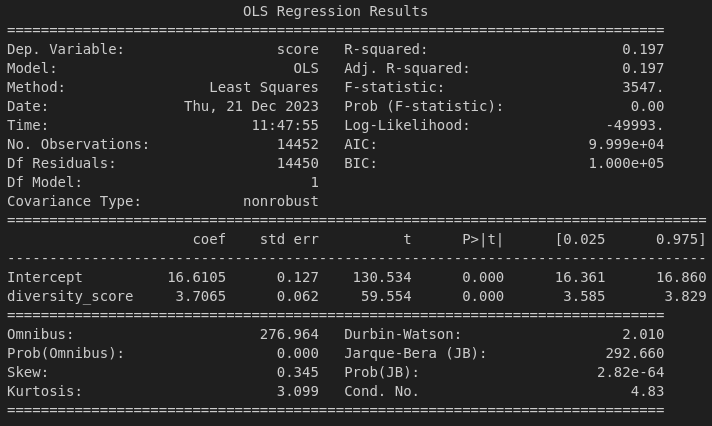
Returning to the earlier question: does the diversity of character types among a director’s works impact the success of their movies? Let’s do an analysis.
Let’s examine some key findings derived from the analysis. Firstly, the coefficient for diversity score is 3.7065, indicating that with each unit increase in the diversity score, we anticipate an approximate 3.7-point rise in the movie score. Essentially, this implies a positive correlation between the movie score and the diversity score. Secondly, the p-value associated with the coefficient is <0.05. This indicates that, within the framework of this model, the coefficients are statistically significant, signifying that the diversity score is indeed valuable in predicting the movie score. However, it’s crucial to note that other factors may influence these results. For a more equitable comparison, we plan to incorporate ‘language’ and ‘country’ matching for the movies. Additionally, we are matching movies with the same score for directors. Let’s do the analysis again.
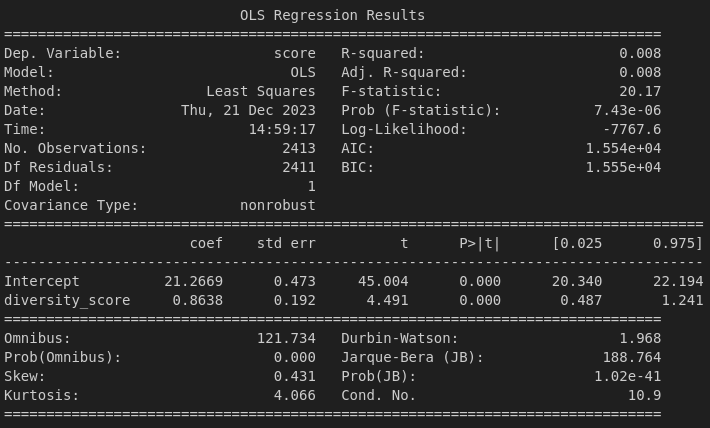
Interesting, after matching, the coefficient for diversity score decrease to 0.8638, indicating that with each unit increase in the diversity score, we anticipate an approximate 0.86-point rise in the movie score, which is less than 3.7-point rise which got before matching. Moreover, the p-value associated with the coefficient is <0.05. This indicates that, within the framework of this model, the coefficients are statistically significant. Consequently, we can infer that while a higher diversity of character choices may contribute to increased movie success, it is also influenced by other factors.
In summary, we can conclude that the diversity of director’s character choices exerts an influence on both the director’s success and the success of the associated movies.
 Frames of Success: Diving into the minds of movie wizards

