Introduction
BeerAdvocate and RateBeer are vibrant online communities where beer enthusiasts gather to share their thoughts on a vast selection of beers. Over the years, these platforms have attracted tens of thousands of users, reflecting both the accessibility of these websites and the popularity of beer appreciation. Yet, beer critique can be far more than a casual pastime - it is a craft that may be pursued with remarkable depth and precision. This becomes evident when you consider the Beer Judge Certification Program (BJCP): achieving their recognition demands rigorous study and practical experience. Aspiring judges must master topics ranging from water alkalinity and malt types to hop varieties, yeast characteristics, and the nuances of fermentation by-products, as described in the BCJP’s beer exam study guide[3].
But what about the wider community of more casual reviewers on BeerAdvocate and BeerReview? Can we, in a similar spirit but with less granularity, evaluate the expertise demonstrated in their reviews? This question opens the door to intriguing possibilities: Do users hone their beer critique skills as they write more reviews? Do linguistic factors, such as native language, influence their reviewing style?
In this data story, we invite you to join us as we explore these questions, using data to uncover insights about beer critique and the diverse community of reviewers behind it.
If you happen to be colorblind, no worries: we have carefully chosen the color palettes for all our plots to ensure they are accessible to everyone!.
Datasets
We have used two datasets, one for BeerAdvocate and one for RateBeer. Both datasets were generously provided by EPFL’s Data Science Lab, who makes them available upon request[2].
Each dataset contains a comprehensive crawling of all beer types, user information, and reviews posted to the respective platforms until 2017. For our study, we have made key additions:
- Language Tagging: Each review was tagged with the language in which it was written. English-language reviews account for 99% of BeerAdvocate reviews and 93% of RateBeer reviews. This allows us to focus exclusively on English reviews without sacrificing data scale, retaining over 9 million reviews for analysis in total.
- Stemming: We applied a stemming algorithm to the reviews, enabling us to focus on the specific terms used.
Post-cleaning, we report 6.6 million english reviews from RateBeer and 2.5 million english reviews for BeerAdvocate. The number of users are approximately the same, with BeerAdvocate having 62k users and RateBeer having 63k users. RateBeer has significantly more beers than BeerAdvocate, with the former having 396k beers and the latter having 234k beers.
The Metric
Developing a methodology to judge a beer critique unavoidably requires some level of domain knowledge from the developers’ side. Here is what we learned, distilled to a pint.
Beers are judged on 4 fundamental factors: Appearance, Aroma, Flavor, and Mouthfeel. Both RateBeer and BeerAdvocate allow users to assign individual ratings for each of these factors as well as the overall score. However, our goal requires exploring how each of these categories are addressed in the textual portion of the review. The terminology for beer critique is largely standardized, and the 1979 paper “Beer Flavour Terminology” by Dr. Meilgaard et al.[1] gives an in-depth presentation of it as well as this handy chart:
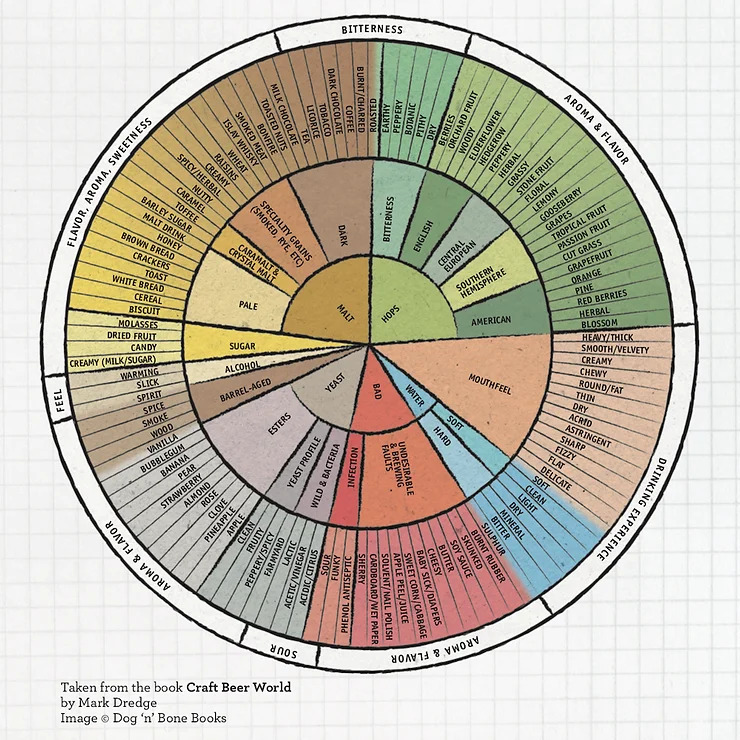
Our goal is to assess how thoroughly the review discusses each category in their written reviews. To achieve this, we employ a simple yet surprisingly effective approach that we apply to each review:
- For every term in the above Flavor Wheel that appeared in the review, we add a point to the review’s coverage score of that term’s category’s. Note that we do not count multiple occurrences of the same term towards the category’s score.
- We sum every coverage score to obtain the final expertise score for the review.
Note that we have integrated additional terms found on BJCP’s learning resources and on other online beer analytics resources[6]. Moreover, we will use the terms “expertise score” and “expertness score” interchangeably.
Here is a small demo of our metric: we illustrate our metric through pairs of example reviews. Each pair corresponds to a type of beer and includes a review that achieves a low expertise score and one that achieves a high expertise score. You may use the buttons to highlight words belonging to each category obtained from the flavor wheel.
Word Cloud
Let’s quickly make the Flavor Wheel more accessible by using a word cloud to see which of these expertise terms are most commonly used.
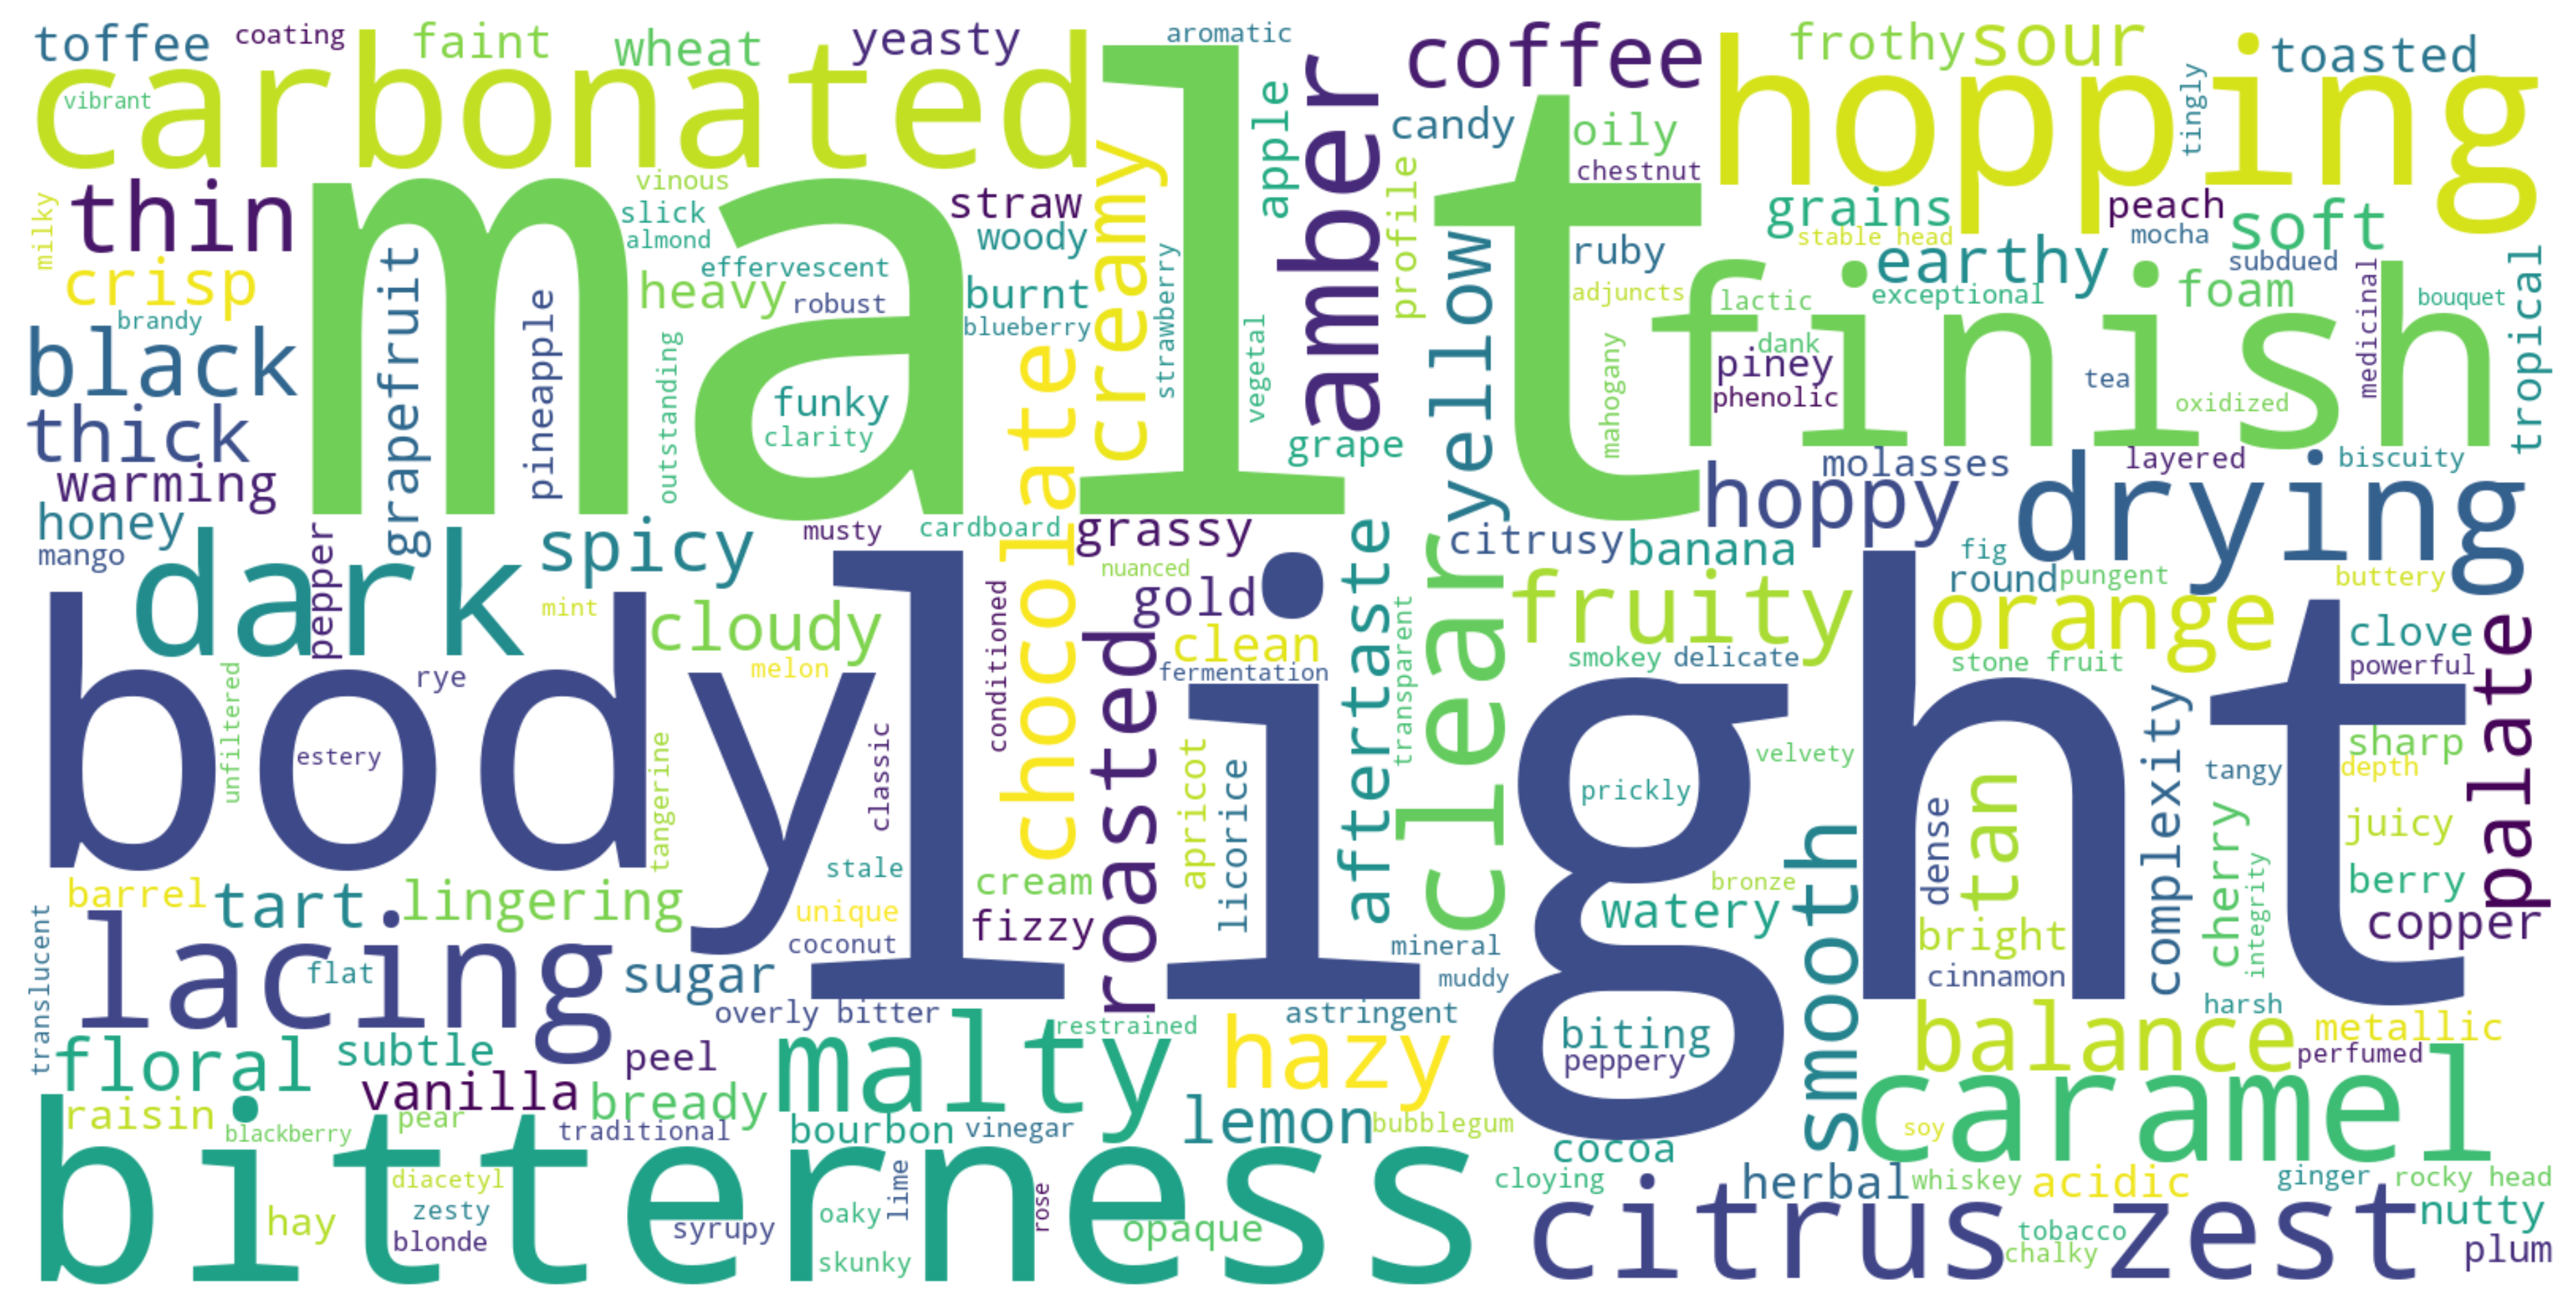
Here are some of the words that appear in the word cloud, ordered by the category they belong to:
- Flavor: Attributes: Words like malt, chocolate, bitter, toffee, toasted, sweet, caramel, fruity, hoppy, spicy, herbal, zest indicate flavor profiles commonly discussed in reviews.
- Mouthfeel: “creamy”, hoppy, foam, thick, thin, crisp
- Appearance: amber, yellow, black, light, clear, hazy
Let’s pair this with a plot to see which term categories are the most used. As we can see, flavor terms are the most prominent, followed by appearance terms. It will turn out that flavor and appearance being more valued and discussed will be a recurring theme in our analysis.
Results
Now that we’ve outlined how we evaluate the expertise level demonstrated in a review, let’s see if we can get some interesting insights with our metric.
Expertise Over Time
It would be reasonable to hypothesize that the reviewers in both websites would improve at critiquing beers as they gain more experience. Under this assumption, if our metric is any good, we should be able to see for the average user a positive upwards trend in the overall expertise score achieved by the reviews they publish over time. Let’s put this to the test by doing just that.
The naive evolution of all the users combined was not as clear as we would’ve hoped. While working further on the topic, we realized that many of the users might have been very proficient before joining the website already. Such users would be experiencing diminishing returns over the reviews they post. So, what if we try grouping users based on their starting expertise? We could do this by quartiles on the average overall expertise score achieved in, say, the first 5 reviews they post on the website. Here is what we get when running this analysis on users with at least a thousand reviews in the BeerAdvocate and RateBeer datasets respectively (the expertness score is after log normalization):
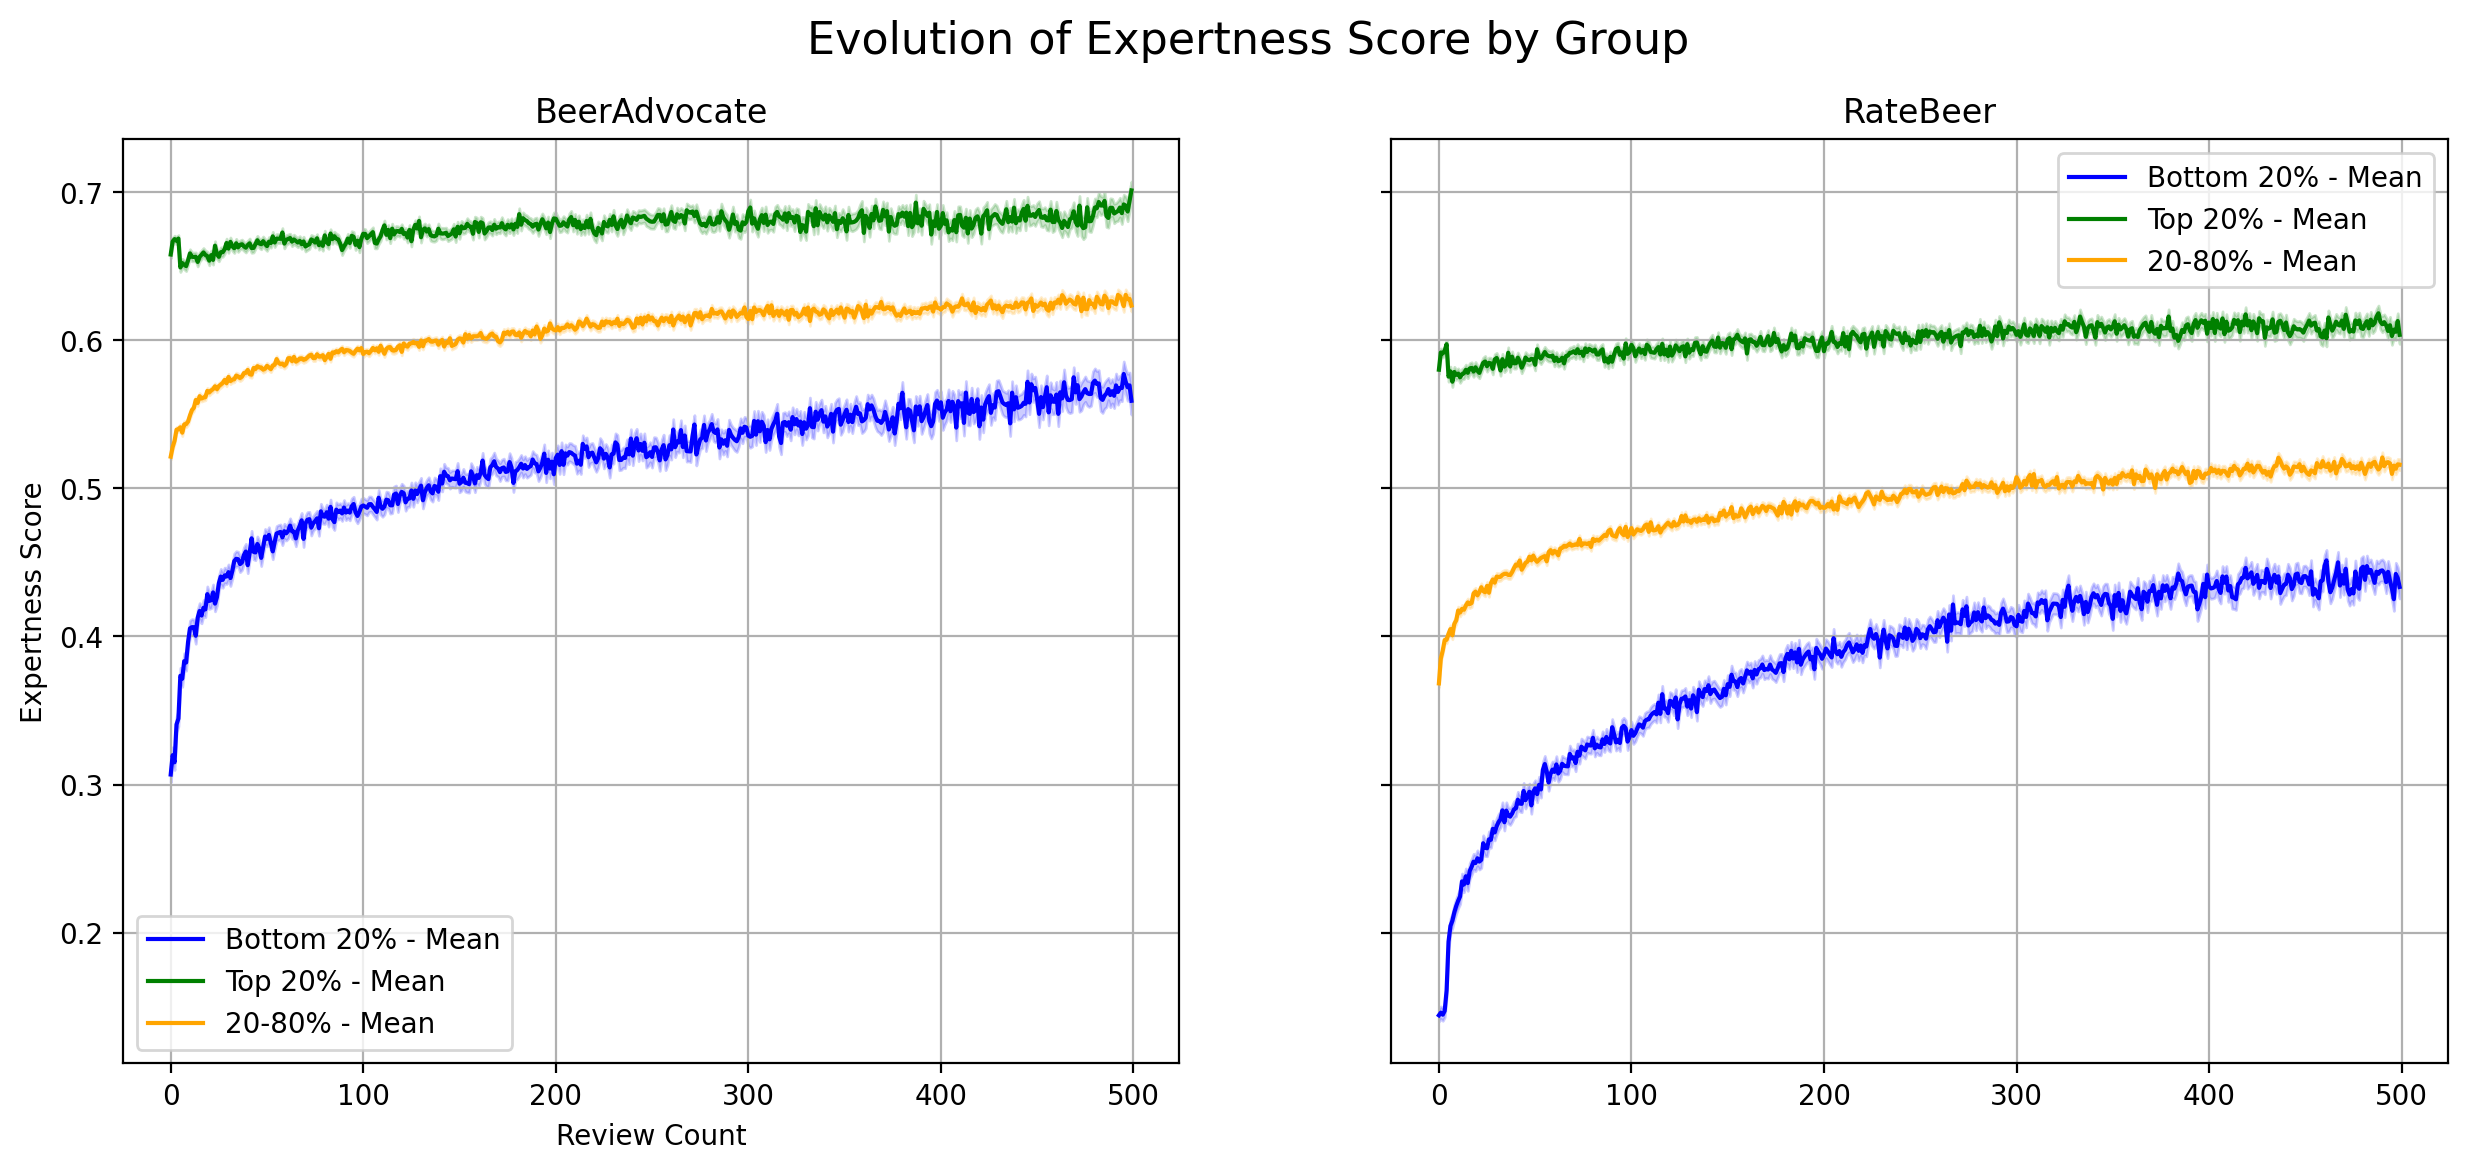
Indeed, in both websites we see that the bottom 20% achieves a very sharp improvement in their expertise scores, slowly reaching a plateau between the 300 and 400 review mark. For these users in the bottom 20% of beginners, the Pearson correlation between posting time and overall expertise is in median 0.34 and 0.26, with median p-values of 0.02 and 0.06, for BeerAdvocate and RateBeer respectively.
| Platform | Median Pearson Correlation | Median p-value |
|---|---|---|
| BeerAdvocate | 0.34 | 0.02 |
| RateBeer | 0.26 | 0.06 |
We also see impressive improvements for the middle 20-80% group of beginners, while the top 20% of beginners has the least amount of improvement and the earliest plateau. Although the trends on improvements closely match each other, we can see that users on RateBeer perform worse than those on BeerAdvocate. A possible explanation that we would like to explore is that RateBeer has a more international community, which might translate into a poorer vocabulary on average. This brings us to performing an analysis of the metric per country.

We now bifurcate our evolution diagrams by English/Non-English countries. One of the first things we notice is that the evolution plots for non-English countries in BeerAdvocate is significantly noisier than the English countries plots. This is due to the fact that BeerAdvocate has majority of its users from the USA, which is an English speaking country. For BeerAdvocate, the evolution trend appears to be the same for both English and non-English users. However, when we switch to RateBeer, we observe something interesting. The non-Experts (rookies) evolve more for English speaking countries than they do for non-English countries. This is possibly due to the fact that learning new beer-specific English words is easier for native English speakers than for non-native speakers. Another interesting thing to see is that the gap between the rookies and the average users is significantly lesser for English users than for non-English users. The experts on the other hand do not let the language barrier separate them from their passion for beer, thus showcasing negligible evolution with their review count.
Expertise Per Country
One of the hypothesis we have is that we expect the average expertness score of English speaking countries to be higher than non-English speaking countries. To test this out, we compute the average score grouped by the location of the users. This includes all the reviews made by users from a particular country. We also filter out countries which do not have at least 20 users with more than 10 reviews each for BeerAdvocate and at least 100 users with more than 10 reviews in RateBeer, to have some confidence in our computed average. Since the location for the United States is state-wise for BeerAdvocate, we combine all users into a single “United States” location. We observe that our hypothesis holds to some extent, with the general trend being that the English Speaking countries outscore the non-English speaking countries. This largely corresponds with the EF English Proficiency Index of 2013[4], where we see that the non-English countries on top of the list indeed have a high average expertness score. We note however the presence of one significant outlier, and that is Belgium, which obtains a low expertness score despite having good English proficiency as a country. For non-English countries like Sweden, Netherlands, Germany, Mexico, Japan, Belgium, Italy and Spain, we see that there is a relation between their english proficiency and their expertness score.
We further investigate the country-wise distribution of expertness scores by looking at the time evolution of the yearly average for some countries. We plot the evolution over time for the top countries plotted in the bar plots above. We notice that the United States maintains a higher score from the beginning for BeerAdvocate, while we observe evolution in all the other countries. There is quite a sharp evolution initially between 2000-2005, and then the scores plateau. For RateBeer on the other hand, we observe a much smoother evolution of the expertise scores with time, possibly due to more data points. This evolution graph is similar to the Expert/Non-Expert analysis we did, but here we have plotted the evolution with time, in contrast to the evolution with the number of reviews earlier.
Impact of popular beer events on reviews quality
Throughout the year there are many events around the world dedicated at least in part to celebrating beer. These events may lead to a noticeable increase in the number of beer reviews posted around the time period. Notable examples are St. Patrick’s Day (Ireland), Oktoberfest (Germany) and 4th of July (USA).

It would be interesting to analyze how these events and the resulting influx of reviews affect the expertise scores of the involved beers and locations. Given the unique nature of each event, we conducted an ad-hoc analysis for each:
- For Oktoberfest we analyzed reviews for beers brewed by the six breweries that participate annually in the event. Specifically, we compared the average expertise score of reviews posted during the Oktoberfest period (across all years) with the overall average expertise score of Guinness beer reviews.
- For St. Patrick’s Day we focused on reviews of Guinness beers, comparing the average expertise score of reviews posted on March 17th (across all years) with the overall average expertise score of Guinness beer reviews.
- For the 4th of July we examined all reviews from U.S.-based reviewers, comparing the average expertise score of reviews posted on Independence Day with the annual average expertise score of U.S. reviewers.
As expected, we see significant spikes in the number of reviews during all these events. The most interesting observation is that we see a whopping 25% increase in the expertness score during the time of St. Patrick’s day. This is very surprising, as we would expect the quality of reviews to go down when people are writing a lot of reviews. In contrast, we only see a 1.8% increase in quality for Oktoberfest. This can be explained by the fact that St. Patrick’s Day is heavily associated with celebrations involving Irish stouts and high-quality beers like Guinness, which might attract more enthusiastic and discerning reviewers. St. Patrick’s Day emphasizes drinking experiences, whereas Oktoberfest often centers around socializing and traditional lagers, which might not evoke as much critical evaluation. Lastly, we notice a 3% drop in review quality for the fourth of July. This is most likely due to the fact that fourth of July is not really a beer festival and the users might not be too concerned with leaving critical reviews.
Analysis by Beer Styles
Beer styles categorize beers based on shared attributes such as ingredients, brewing techniques, and flavor profiles. Do some beer styles tend to give different results with our expertise metric?
Categorical Coverage
The interactive radar chart below visualizes the average contribution of each term category to the final expertise score across several popular beer styles. The values are normalized as fractions of the maximum average weight achieved by each category.
Reviews of beers in the Black & Tan style show the highest reliance on Appearance terms, which reflects the visually striking looks of these beers. The most striking anomaly however emerges with the Gueuze beer style, whose reviews are dominated by terms in the off-flavor category (which corresponds to the undesirable flavors in Meilgaard’s wheel). Gueuze is indeed a peculiar beer style. Its fermentation process involves wild yeasts and bacteria, which produce complex flavors that can include what are traditionally considered “off-flavors” in other beer styles, such as funk and sourness. These flavors are not defects in the context of Gueuze but are instead key elements of its profile.
 Black & Tan: A black and tan is prepared by filling a glass halfway with pale ale, then adding stout to fill the glass completely. An upside-down tablespoon may be placed over the glass to avoid splashing and mixing the layers. A specially designed black-and-tan spoon is bent in the middle so that it can balance on the edge of the pint-glass for easier pouring. The "layering" of Guinness on top of the pale ale or lager is possible because of the lower relative density of the Guinness. |
 Gueuze: Due to its lambic blend, gueuze has a different flavor than traditional ales and lagers. Because of their use of aged hops, lambics lack the characteristic hop aroma or flavor found in most other beers. Furthermore, the wild yeasts that are specific to lambic-style beers give gueuze a dry, cider-like, musty, sour, acetic acid, lactic acid taste. Many describe the taste as sour and "barnyard-like".
|
Beers with the most in-depth reviews for each category
Let’s analyze the relation between expertise scores and beer styles further. We will show the top beers for each of our expertise scores, which gives us the following insights:
- Appearance: both BeerAdvocate and RateBeer have darker beers at the top. Black & Tan, Black Ales, Dark Ales, Stouts, Schwarzbier… It seems darker shades of beers tend to receive a deeper treatment on their appearance.
- Off-flavors are more deeply discussed in Gueze style beers (as we have seen before) but more generally in Lambic and Sour beers.
- Brewing techniques are discussed more in-depth for the classic ales such as Wheat Ale and others.
- Mouthfeel is discussed particularly in-depth for Stouts in both websites and, in the more international RateBeer, also for Saké.
- Flavor is heavily discussed in the widely popular Stouts and Indian Pale Ale beers.
- Overall expertise is highest in the most popular beers such as American Black Ale and Black IPA.

More about our metric - Scores Correlation Matrix
How do our expertise scores correlate with the reviewer’s rating of the review? Could it be that reviewers show more expertise for beers that they have enjoyed? Let’s use a correlation matrix to find out.
- The upper left quadrant (shaded red) shows us the correlations between the different numeric ratings given by the reviewer (this is independent from our metric). It is interesting to see how the taste rating is so heavily correlated to the overall rating of the beer, in comparison to the other numerical ratings.
- Our expertise scores are not strongly correlated to the numerical ratings left by the user, which gives a blue shade to our lower left quadrant. This is good, although we do note in general a slightly positive correlation. A possible explanation for this is that reviewers tend to write more in-depth for beers that they have enjoyed.
- The expertise score for off-flavor is unique in having a negative correlation with all of the numeric ratings, which matches with the generally negative connotation carried by terms in that category.
- The overall expertise score is most heavily influenced by the expertise score for flavor, which means that reviewers tend to write more in-depth about that aspect of the beer. This adds evidence to flavor being the aspect to which reviewers tend to give the most weight.

Hall of Fame: the best reviewers
Which reviewers should you follow to get the best reviews? Here is a list of the reviewers who achieved the highest average expertise scores.
For BeerAdvocate:
| Username | Location | Number of reviews | Expert Score |
|---|---|---|---|
| StephenRich | Canada | 176 | 17.23 |
| TheBrewo | United States, New York | 1236 | 15.17 |
| 911CROFT | England | 144 | 13.60 |
| superspak | United States, Michigan | 5603 | 13.19 |
| CHickman | United States, New York | 1795 | 12.55 |
| flayedandskinned | United States, California | 135 | 12.35 |
| Jadjunk | United States, Georgia | 1175 | 12.20 |
| Bmoyer0301 | United States, Pennsylvania | 114 | 12.10 |
| fmccormi | United States, California | 532 | 12.07 |
| BarryMFBurton | United States, Indiana | 628 | 11.89 |
| hustlesworth | United States, Ohio | 689 | 11.85 |
| mdagnew | Northern Ireland | 1143 | 11.52 |
For RateBeer:
| Username | Location | Number of Ratings | Expert Score |
|---|---|---|---|
| GoufCustom | Hong Kong | 1832 | 13.34 |
| superspak | United States, Michigan | 4847 | 13.14 |
| msnelling09 | United States, Massachusetts | 148 | 12.72 |
| pinkie | United States, New York | 386 | 11.23 |
| FlacoAlto | United States, Arizona | 3538 | 11.21 |
| ksurkin | United States, Virginia | 722 | 10.51 |
| Bierdimpfe | Canada | 639 | 9.94 |
| Night_Cap | Australia | 109 | 9.83 |
| Alengrin | Belgium | 5507 | 9.44 |
| beermatrix | United States, Minnesota | 1233 | 9.07 |
| otakuden | United States, Florida | 1446 | 8.98 |
| Jabic | United States, Vermont | 452 | 8.97 |
| brewandbbq | United States, New Hampshire | 233 | 8.89 |
| jpm30 | United States, Georgia | 1451 | 8.81 |
Interestingly, the highest average expertise scores for BeerAdvocate are higher than those for RateBeer. Props to user “superspak”, who appears among the top experts in both the datasets!
Conclusions
In conclusion, we provided a simple method to quantify the technical depth of beer reviews by computing the coverage of a set of technical terms obtained from beer critique literature. Using this method we have obtained the following interesting results:
- Certain beer styles being on average more profoundly scrutinized by the reviewers on their most salient aspects.
- The presence of a strong initial improvement on the expert scores obtained by the reviewers as they gain more experience, and the dependence of the slope of the improvement and its plateau on the initial expertise of the reviewers.
- The sentiment of the review not having a strong influence on the expertise score it recieves.
- Flavor being discussed on average more in-depth than the other aspects.
- The expertise score matching per-country data from the EF English Proficiency Index.
The Team
This Data Story is brought to you by the Nada-401 team as part of a project for the 2024 Applied Data Analysis course at EPFL. The team members are, in alphabetical order:
Vikhyat Agrawal
Manuel Curnis
Alessandro Di Maria
Daniele Pusceddu
Nicola Stocco
References
- Meilgaard, M.C., Dalgliesh, C.E. and Clapperton, J.F., 1979. Beer flavor terminology. Journal of the American Society of Brewing Chemists, 37(1), pp.47-52.
- Lederrey, G. and West, R., 2018, April. When sheep shop: Measuring herding effects in product ratings with natural experiments. In Proceedings of the 2018 world wide web conference (pp. 793-802).
- Edward Wolfe, Scott Bickham, David Houseman, Ginger Wotring, Dave Sapsis, Peter Garofalo, Chuck Hanning, Steve Piatz, Gordon Strong, 2017.BCJP Beer Exam Study Guide.
- EF English Proficiency Index, 2013. https://www.ef.com/assetscdn/WIBIwq6RdJvcD9bc8RMd/cefcom-epi-site/reports/2013/ef-epi-2013-english.pdf
- Beer Judge Certification Programme. BJCP.
- Beer Analytics. Beer Analytics.