Through feature engineering, various metrics were defined with the goal to detect the channels that had undergone a sudden success and later to draw apart the two desired populations (keep_fame and lose_fame). These are listed and explained in detail in this page.
Metric 1: Channel growth
This metric is used as a first step to distinguish between the populations of who lost and who gained fame after sudden success. It is defined as the following:
begin, end = ts_grouped_by_channel['views'].first(), ts_grouped_by_channel['views'].last()
peak = ts_grouped_by_channel['max_growth_views'].max()

growth = (end - begin) / (peak - begin)
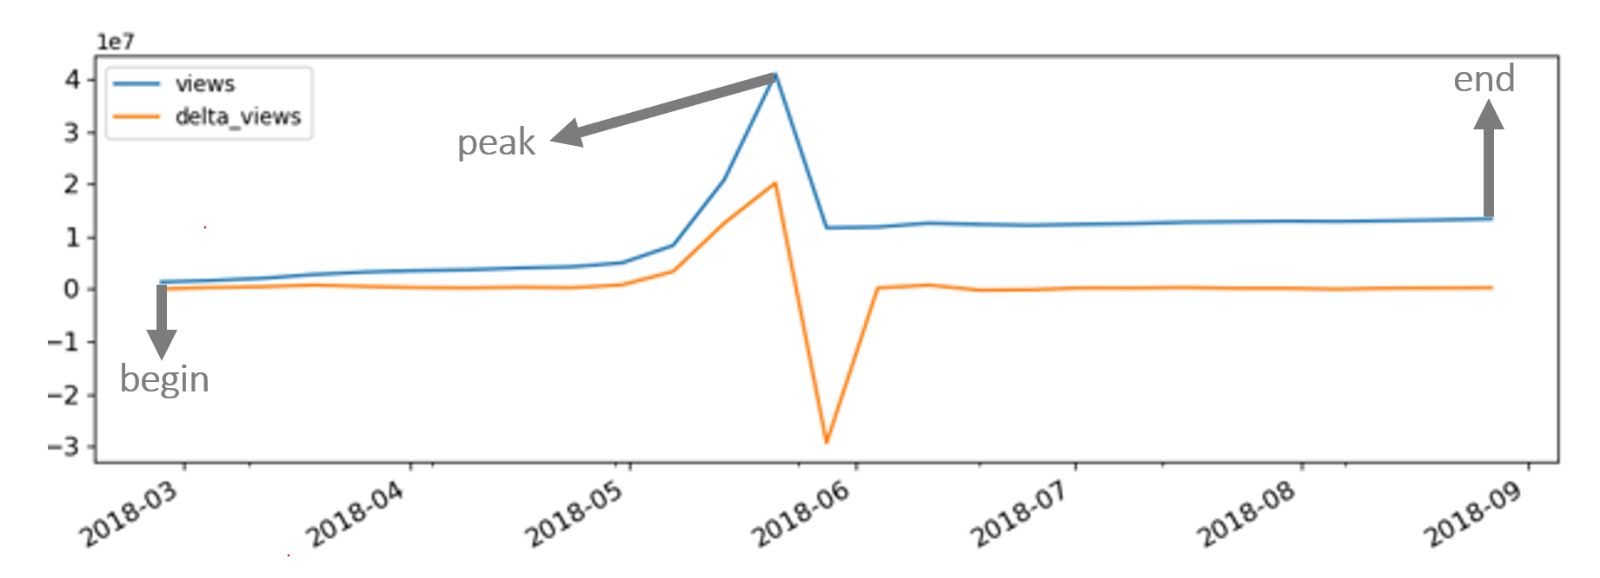
It’s the variation of views from the end and the beginning of the observation period considered over the difference between the spike views (corresponding to those obtained at the date of maximum growth rate) and the views at the beginning of the 6 months observation period. It displays whether the channel gained, lost views, or if they remained more or less constant, and it compares this value to the overall success the channel had (the relative increase during the spike) i.e. to what extent did the channel grow over the observation period compared to the maximum variation of views it had within the same period.
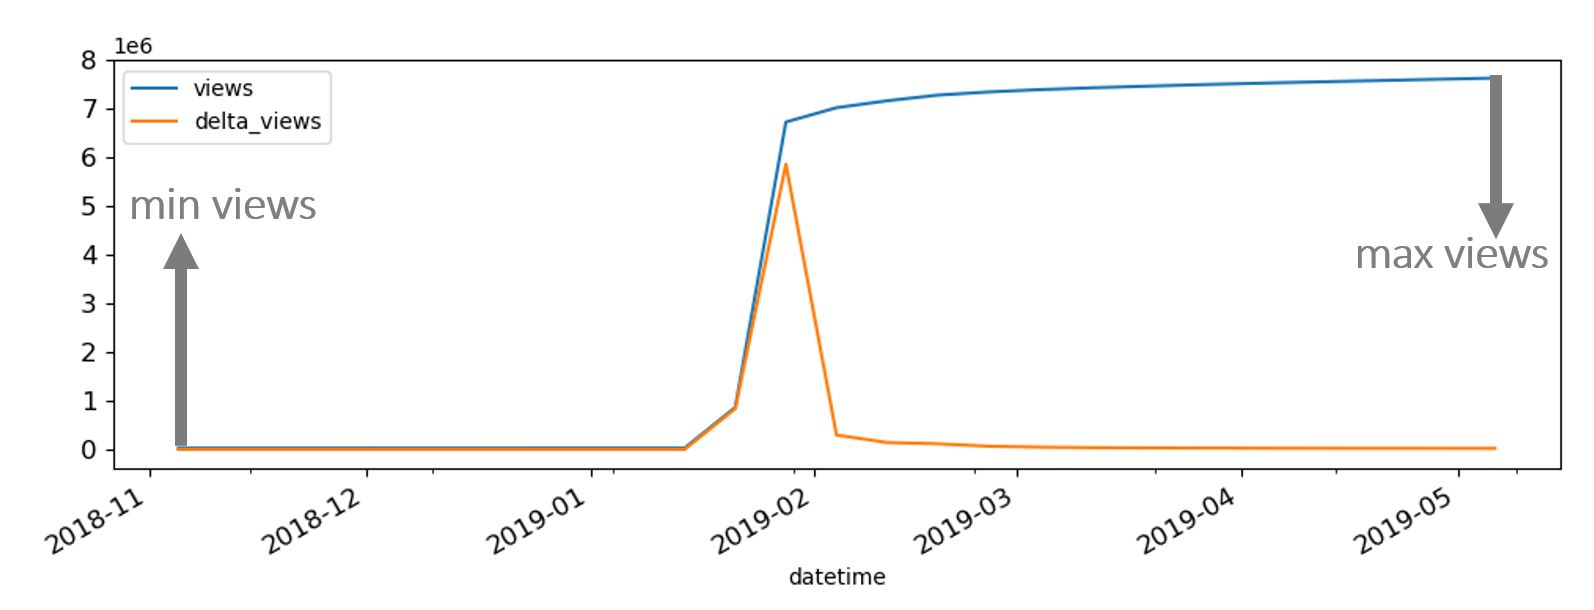
Metric 2: Views variability
This metric is an indicator of the variability of the views during the observation period per channel, giving insights about the relative extent to which the visualizations varied. It is computed by making the difference between the maximum and minimum number of views, normalized with respect to the maximum.
max_views = ts_grouped_by_channel['views'].max()
min_views = ts_grouped_by_channel['views'].min()

variability = (max_views - min_views)/(max_views)
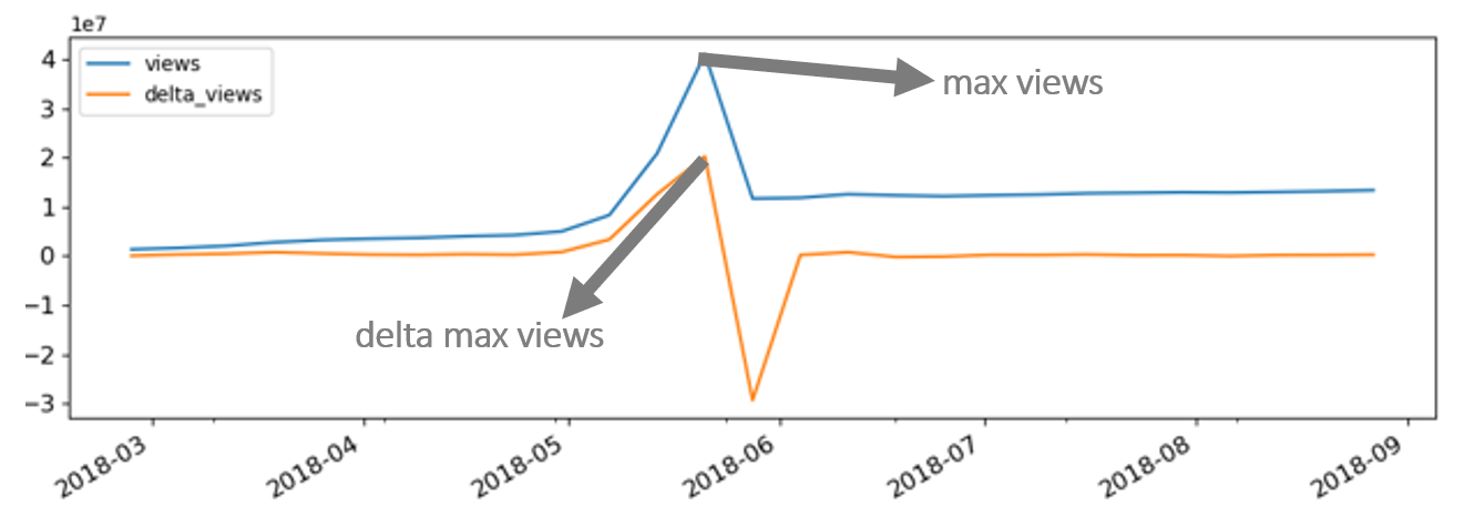
Metric 3: Views growth steepness
This is a metric obtained from the maximum number of new views gained in a week with respect to the week before, divided by the maximum number of views overall. It allows to detect if the growth was steep (in other words, if the newly gained views had a significant impact on the overall views), by comparing the orders of magnitude of the two quantities.
delta_max = ts_grouped_by_channel["delta_views"].max()

growth_steepness = (delta_max)/(max_views)