Why Youtube?
Viral videos dominate the always-changing landscape of Youtube trends and many channels go through a brief but explosive moment of fame. While some are able to turn this sudden success into long-term engagement, others quickly sink into oblivion. What is then the winning strategy of these first lucky creators (and do they even have any)? Are there specific contents for which is easier to ride the wave of fame after the fast spike in visibility? These and more questions will be answered by the study here presented, based on the YouNiverse dataset, a large collection of channel and video metadata from English-language YouTube. A first introduction to the dataset, as well as the exploratory analysis is available in its dedicated page.
Youtube is the most popular video sharing platform in the world, with over 2 billion users and 500 hours of video uploaded every minute. It is also the second most popular search engine, after Google. Therefore it’s deemed as a great starting point to understand how creators can exploit sudden and exponential growth. From YouNiverse, we extracted channels that have undergone a sudden increase in terms of views and then split these into the “keep-fame” and “lose-fame” populations.
How did we proceed?
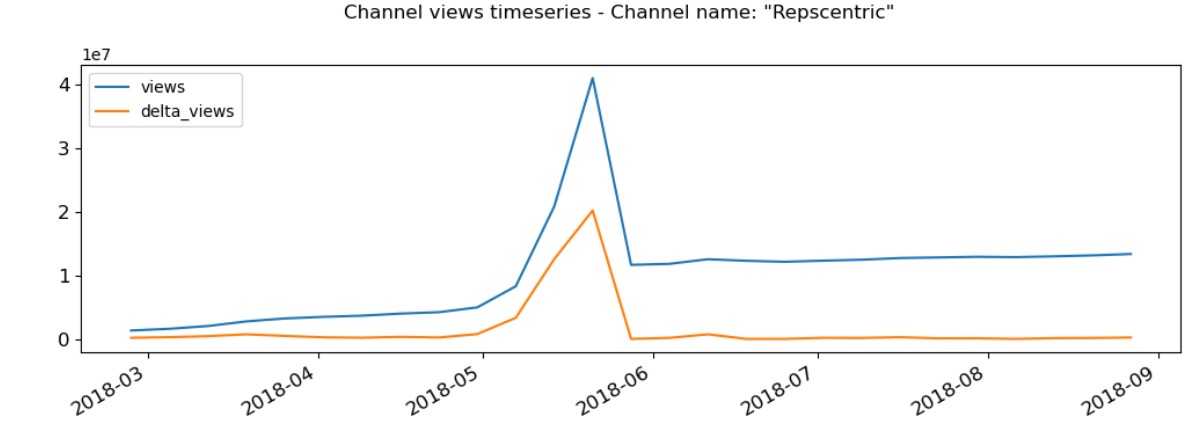
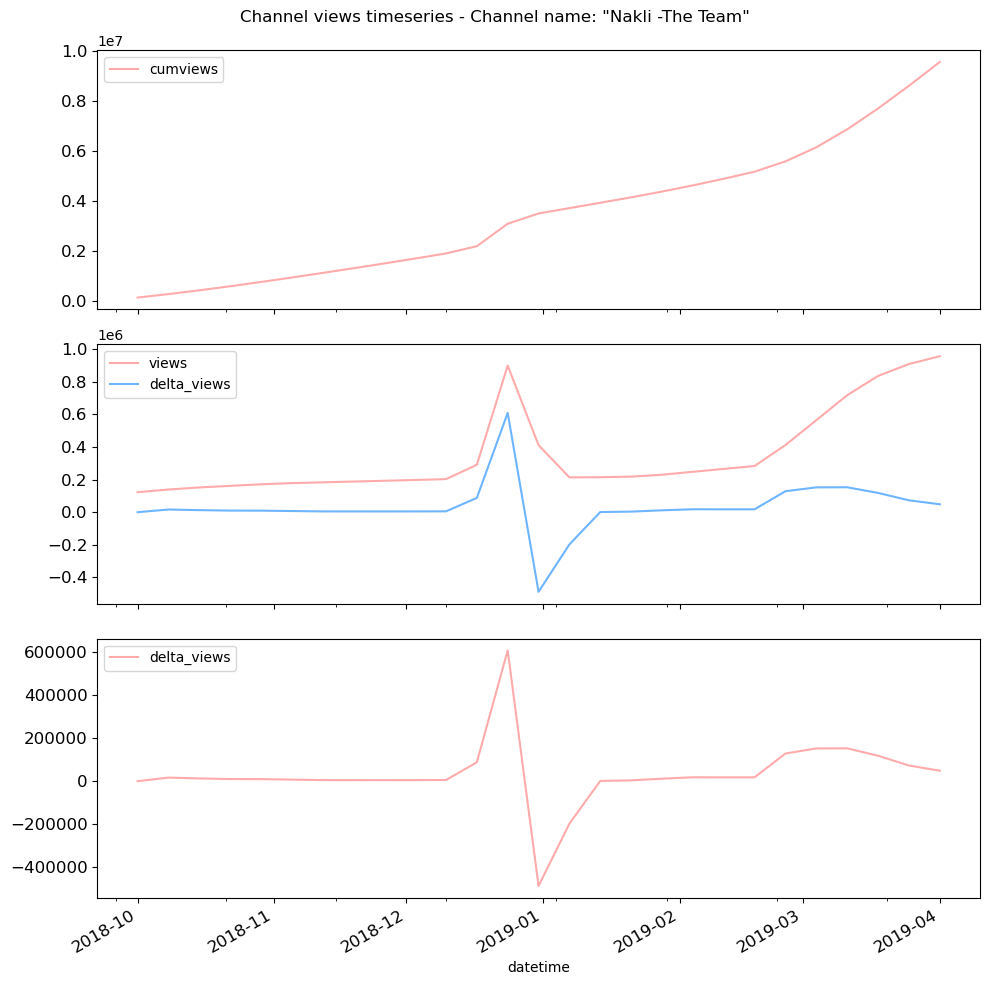
Firstly, in order to perform our analysis, important preprocessing steps had to be carried out to extract new variables to enrich the dataset with the goal of identifying a rapid growth in the channels’ views and allowing for detailed filtering. This step is described in detail in the preprocessing section.
Afterwards, through feature engineering, we defined various metrics to better quantify the growth of channels that had undergone a sudden success and, later, to draw apart the two desired populations. The antecedent preprocessing revealed itself as fundamental, since it allowed us to assign to each channel the maximum growth rate and the associated timepoint at which the views peaked. The defined metrics are described in detail in the metrics section.
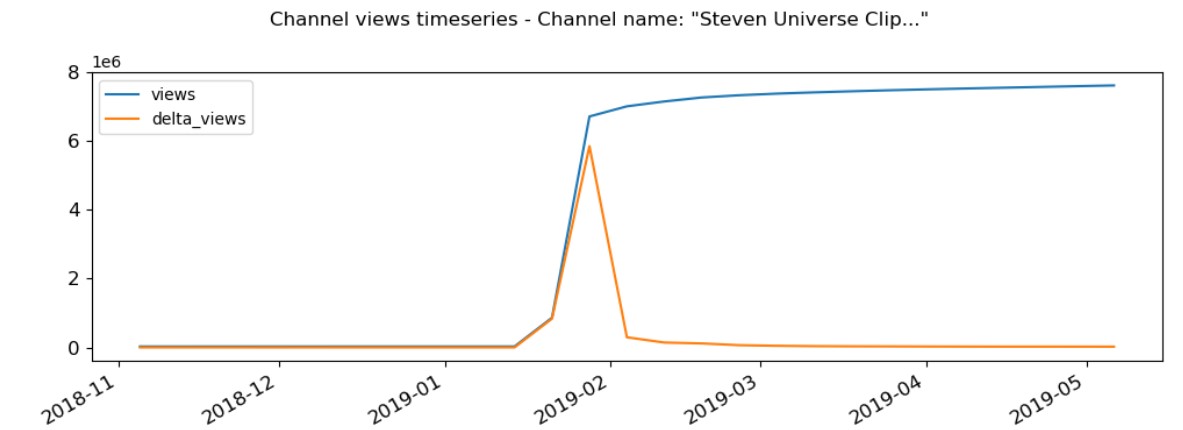
We later selected those channels that had a very steep sudden growth and then discarded all the ones that, before growing rapidly, displayed an abrupt decrease in views (as their growth is affected by their previous popularity).
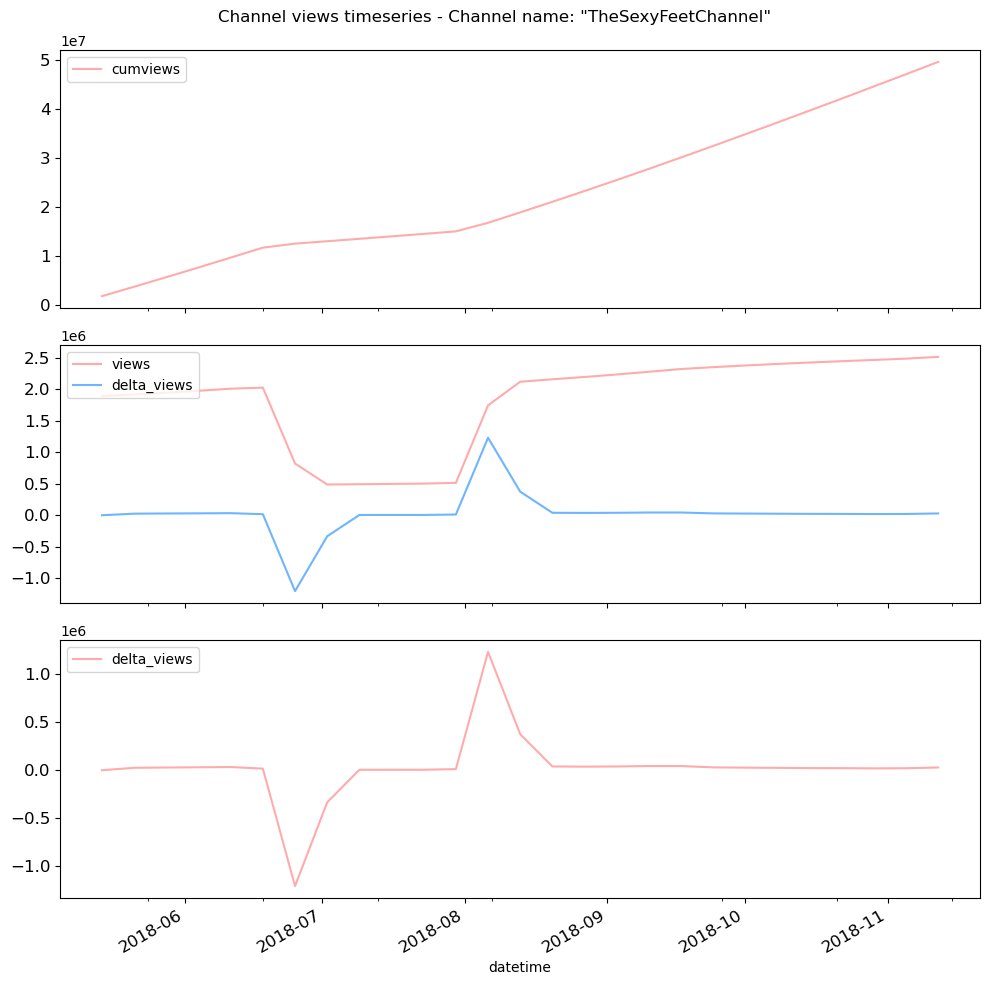
Moreover, we discarded all the channels that lost views after the peak but regained them before the end of the observation period, as they could’ve been wrongly assigned to the keep-fame population.
At this point, having clearly identified our two populations, we were able to perform propensity score matching, as extensively explained in its dedicated section. To eliminate the observed confounding factors, we picked the following column variables to be used as regressors in the propensity score matching:
subscribers_ccvideos_ccsubscriber_rank_sbweightsgrowth_ratevariabilitygrowth_steepness
We standardized them, converted the categorical variables into dummy indicators, computed the propensity scores, and added them to the identified keep_fame and lose_fame populations. This led to 163 matched pairs to be used for the ensuing analysis.
What did we find?
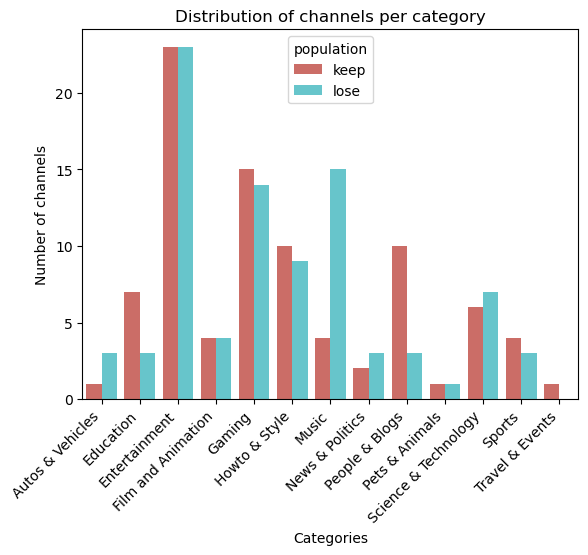
In order to grasp what are the strategies that allow a channel to maintain the conquered visibility, the data of each channel of the keep_fame and lose_fame populations were split into two groups, each referring to the timespan previous or following the growth peak. To avoid bias, we only selected the channels that had videos before and after their peak (and within the observed 6 months), ending up with 88 elements for each population.
We decided to compare the two populations across several selected features:
- frequency of publications
- videos length
- number of tags
Furthermore, we observed the distributions of the categories in the 4 populations. This step was carried out to check if successful creators stay consistent with their content or try to adapt it to the interests of their newly-found large audience. As a matter of fact, when computing the propensity scores, the coefficients found for the categories regressors were not statistically significant. We could hence infer that there are not particular categories more prone to exploiting a viral moment. However, content creators seem to vary their content after the sudden growth, as distribution of videos over categories changes after the peak in many of the channels in both populations (ChiSquared independence test).
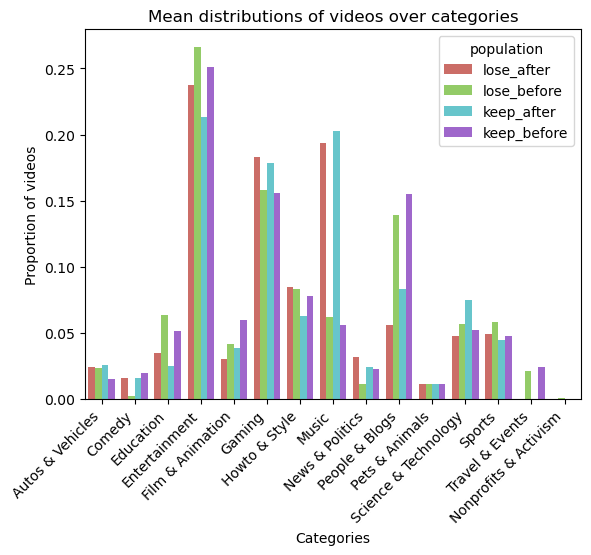
From the average distributions of videos over categories an interesting fact stood out. Indeed, while not many music videos were posted by the considered channels before going viral, their presence dramatically increases after the viral outburst in both populations.
To compute the distributions of the frequency of publications we divided the number of videos before and after the sudden growth for both populations by the time of observation (respectively 12 weeks before and 14 weeks after the peak for both groups). The same was done for the length of videos and the number of tags.
Here the boxplots obtained for each feature are shown:
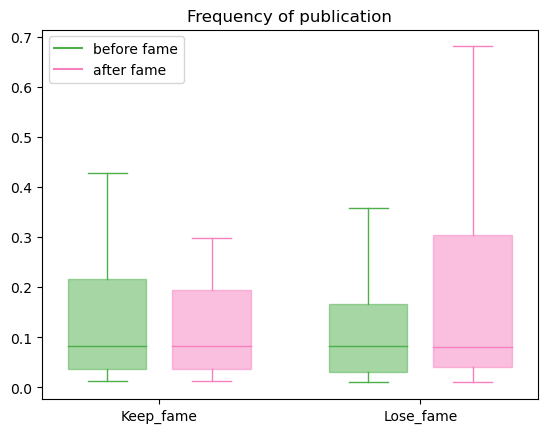
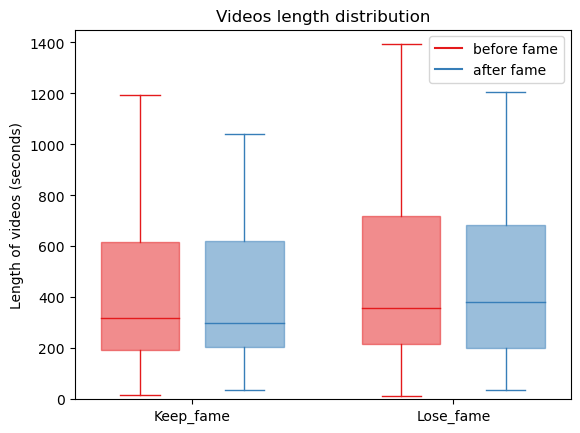
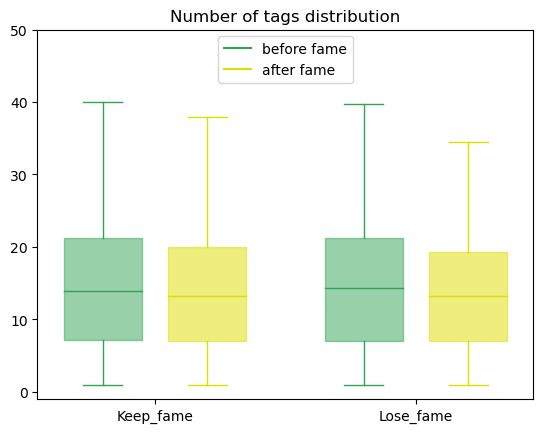
These metrics were chosen as they are thought to be indicative descriptors of a channel’s strategy. Their importance is well known by content creators and we were expecting visible differences. Nonetheless, to our surprise, the statistical tests (cfr figure below) performed on the obtained distributions were not found to be significant.
scs.ttest_rel(freq_publication_keep_after_sudden_growth, freq_publication_keep_before_sudden_growth)
scs.ttest_ind(freq_publication_keep_after_sudden_growth, freq_publication_lose_after_sudden_growth)
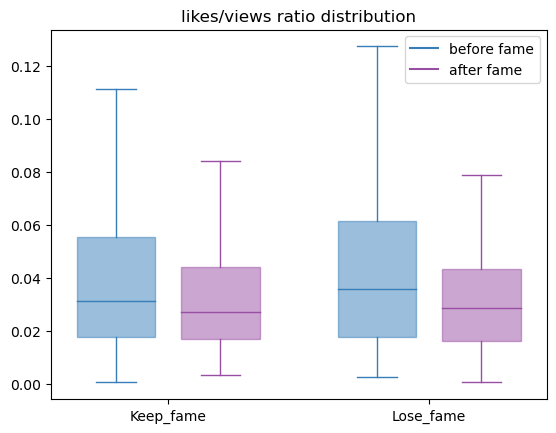
Only the independent test on the mean in frequency publication of the keep_fame and lose_fame populations gave results close to the level of statistical significance. This is curious, the fact that successful creators post more than forgotten ones could actually be a useful hint. As an ensuing step, we computed the number of likes per channel normalized over the number of views. After performing paired and independent statistical tests, we found that:
- Channels that manage to keep the acquired fame increase the number of likes per video in the months following the spike;
- After their sudden success, winning channels earn a higher number of likes per video compared to channels that lose visibility.
This observation is fairly intriguing given that while watching a video is a passive action, liking the content is an active and explicit form of appreciation. Given that likes are deemed as good indicators of the quality of the content and the creator’s ability to target their audience, an hypothesis could be that these are indeed the factors that played the greatest role in the success of the channels that managed to keep their fame.
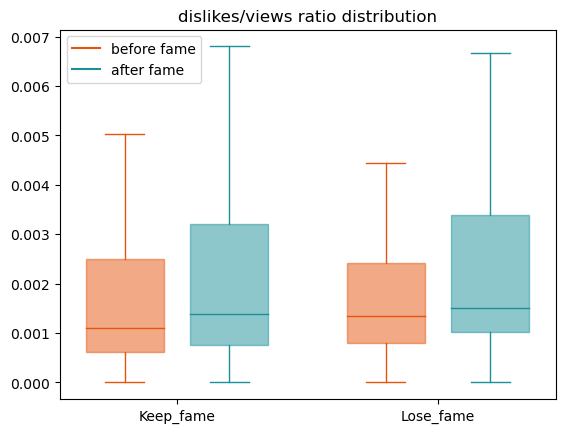
On the other hand, dislikes seemed to remain the same for both populations before and after their viral moment. The number of dislikes normalized over the views of both populations after the fame is also quite similar across populations.
We proceeded by repeating the same analysis within categories. As the categories most represented in our populations were “Entertainment”, “Gaming”, “Music”, and “Howto & Style”, we selected these for this next part of the analysis. We considered the same features as before.
Again, we did not find anything to be statistically significant, with a notable exception: gaming channels that manage to keep their fame posted less videos than what they did before the sudden growth.
What can we conclude?
We imagine that these results may seem disappointing to the reader, to whom we promised the secret recipe to YouTube fame. On the contrary, to us they are rather satisfactory. It seems that intrinsic data features, such as the number of tags or the length of videos are not sufficient to explain the phenomenon of YouTube long term fame after a viral success. On the other hand, the amount of likes, which is the main indicator of the viewers level of appreciation of the posted content, appears to be linked to the chances a creator has to establish durable fame. This suggests that overall it’s the creator ability to be liked by its viewers that makes the bigger difference. Seeing that in these last years YouTube, as most social media, has been accused of being completely ruled by its algorithm, our conclusion sounds to us even more refreshing. It appears that YouTube visibility is not, as some had insinuated, blatantly a game of guessing the right number of tags or videos length. There doesn’t even seem to be a category more prone to keep the sudden visibility: it’s the unobserved covariates that matter the most.
To conclude our analysis, ADAngerous team suggests to all the fellow Youtube creators that were able to gain sudden visibility to prioritize the quality of their videos, to pay attention to the audience’s preferences, and, most importantly, to work with passion and creativity.
Finally, we whish to our readers, who have reached the end of this datastory, ADAngerously happy new year!