

Mapping the battlefield
To understand the war, we first had to identify the armies. We didn’t just look at “Politics” vs. “Sports” as monoliths. We sifted through the noise of 858,488 raw hyperlinks to isolate the 67,742 interactions that truly matter. This allowed us to map the tricky, often hidden movements of troops inside these fields.
Politics was the louder theater of war on Reddit from 2014 to 2017 with 40,415 hyperlinks, but the sports arena was far from silent. Despite the difference in volume, we gathered ample intelligence from both fronts to be able to uncover their hidden patterns.
To map these territories, we started with the SNAP subreddit embeddings dataset. We reduced the embeddings dimensionality from 300 to 2 using PCA (preserving 94% of the variance) and then applied K-means clustering. We determined the optimal number of clusters using Silhouette and Davies-Bouldin scores.
The raw optimal score has the highest Silhouette with the lowest Davies-Bouldin.
Both scores pointed to 20 clusters as the optimal balance, providing enough granularity to distinguish factions while keeping the groups large enough to be meaningful. This allowed us to isolate specific communities effectively.
We then used max similarity to identify the subreddits mathematically closest to our manual selection. Finally, we investigated these key players to map them to specific camps. In Politics, this revealed the Trump conservatives, Progressives, Mainstream news, Conspiracy theorists, and the chaotic Alt-right. In Sports, the tribes aligned clearly with the NFL, Soccer, NBA, and Hockey.
Defining the weapons
Before we map the war, we must define the ammunition. On Reddit, communities link to each other constantly. But not all links are friendly.
We distinguish between two types of negativity:
- Textual negativity (VADER): this measures the tone of the words used in a post. A post can use negative words (e.g. “This is a sad situation”) without being hostile towards others.
- Explicit hostility (LINK_SENTIMENT): this is our gold standard. It captures the intent of the link. A value of -1 means the post was explicitly created to attack, mock, or criticize the target community.
In this story, we focus on explicit hostility. We aren’t just looking for grumpy people; we are looking for people who crossed a digital border to pick a fight.
The charts above reveal a striking imbalance. In Politics, while most camps get hammered with similar levels of hostility (make sure to select the Target option above), they don’t dish it out equally. The Mainstream news and Progressive communities are relatively restrained, whereas the Gender politics, Anti-Trump, and Meta-drama camps are significantly more hostile towards others.
In Sports, it’s a different world, much less violent, with hostility levels 3.3 times lower on average. College sports fans are the peacekeepers, with an impressive 81.53% positive interaction rate. But even here, there’s a villain: the Meta-drama camp (yes, it exists in sports too) lives up to its name, generating the most conflicts with 24.95% hostile hyperlinks.
The heat of battle
We know, like us, that you’re now also wondering: who is attacking whom?
In Politics, the hostility is systemic. The Conspiracy theorists and Alt-right factions lead the assault, with Anti-Trump and Libertarian communities also joining the offensive. On the receiving end, Mainstream news stands alone as the central battlefield, absorbing the crossfire from all sides. Meanwhile, Gender Politics is largely ignored.
In Sports, the dynamic is shockingly one-sided. It is not a series of rivalries, but a collective pile-on. NFL General is the sole lightning rod, taking massive hits from every other tribe. While everyone joins in to attack the NFL, the other communities, from Soccer to Hockey, remain virtually unscathed.
The chord diagram highlights the number of hostile hyperlinks sent from one group to another, but it doesn’t display positive links. It’s possible that Conspiracy might actually send a good proportion of positive hyperlinks to the News mainstream cluster, although we all know it won’t be the case.
To check this, we computed hostility rates and visualized them with a heatmap. This chart shows, for every pair of clusters, the proportion of hostile hyperlinks and makes clear how each group behaves toward the others.
We see above that Meta-drama, like always, initiates a lot of hostility. Also, the Conspiracy hates the Gender politics more than the News mainstream, which is quite surprising.
Reaction to shockwaves
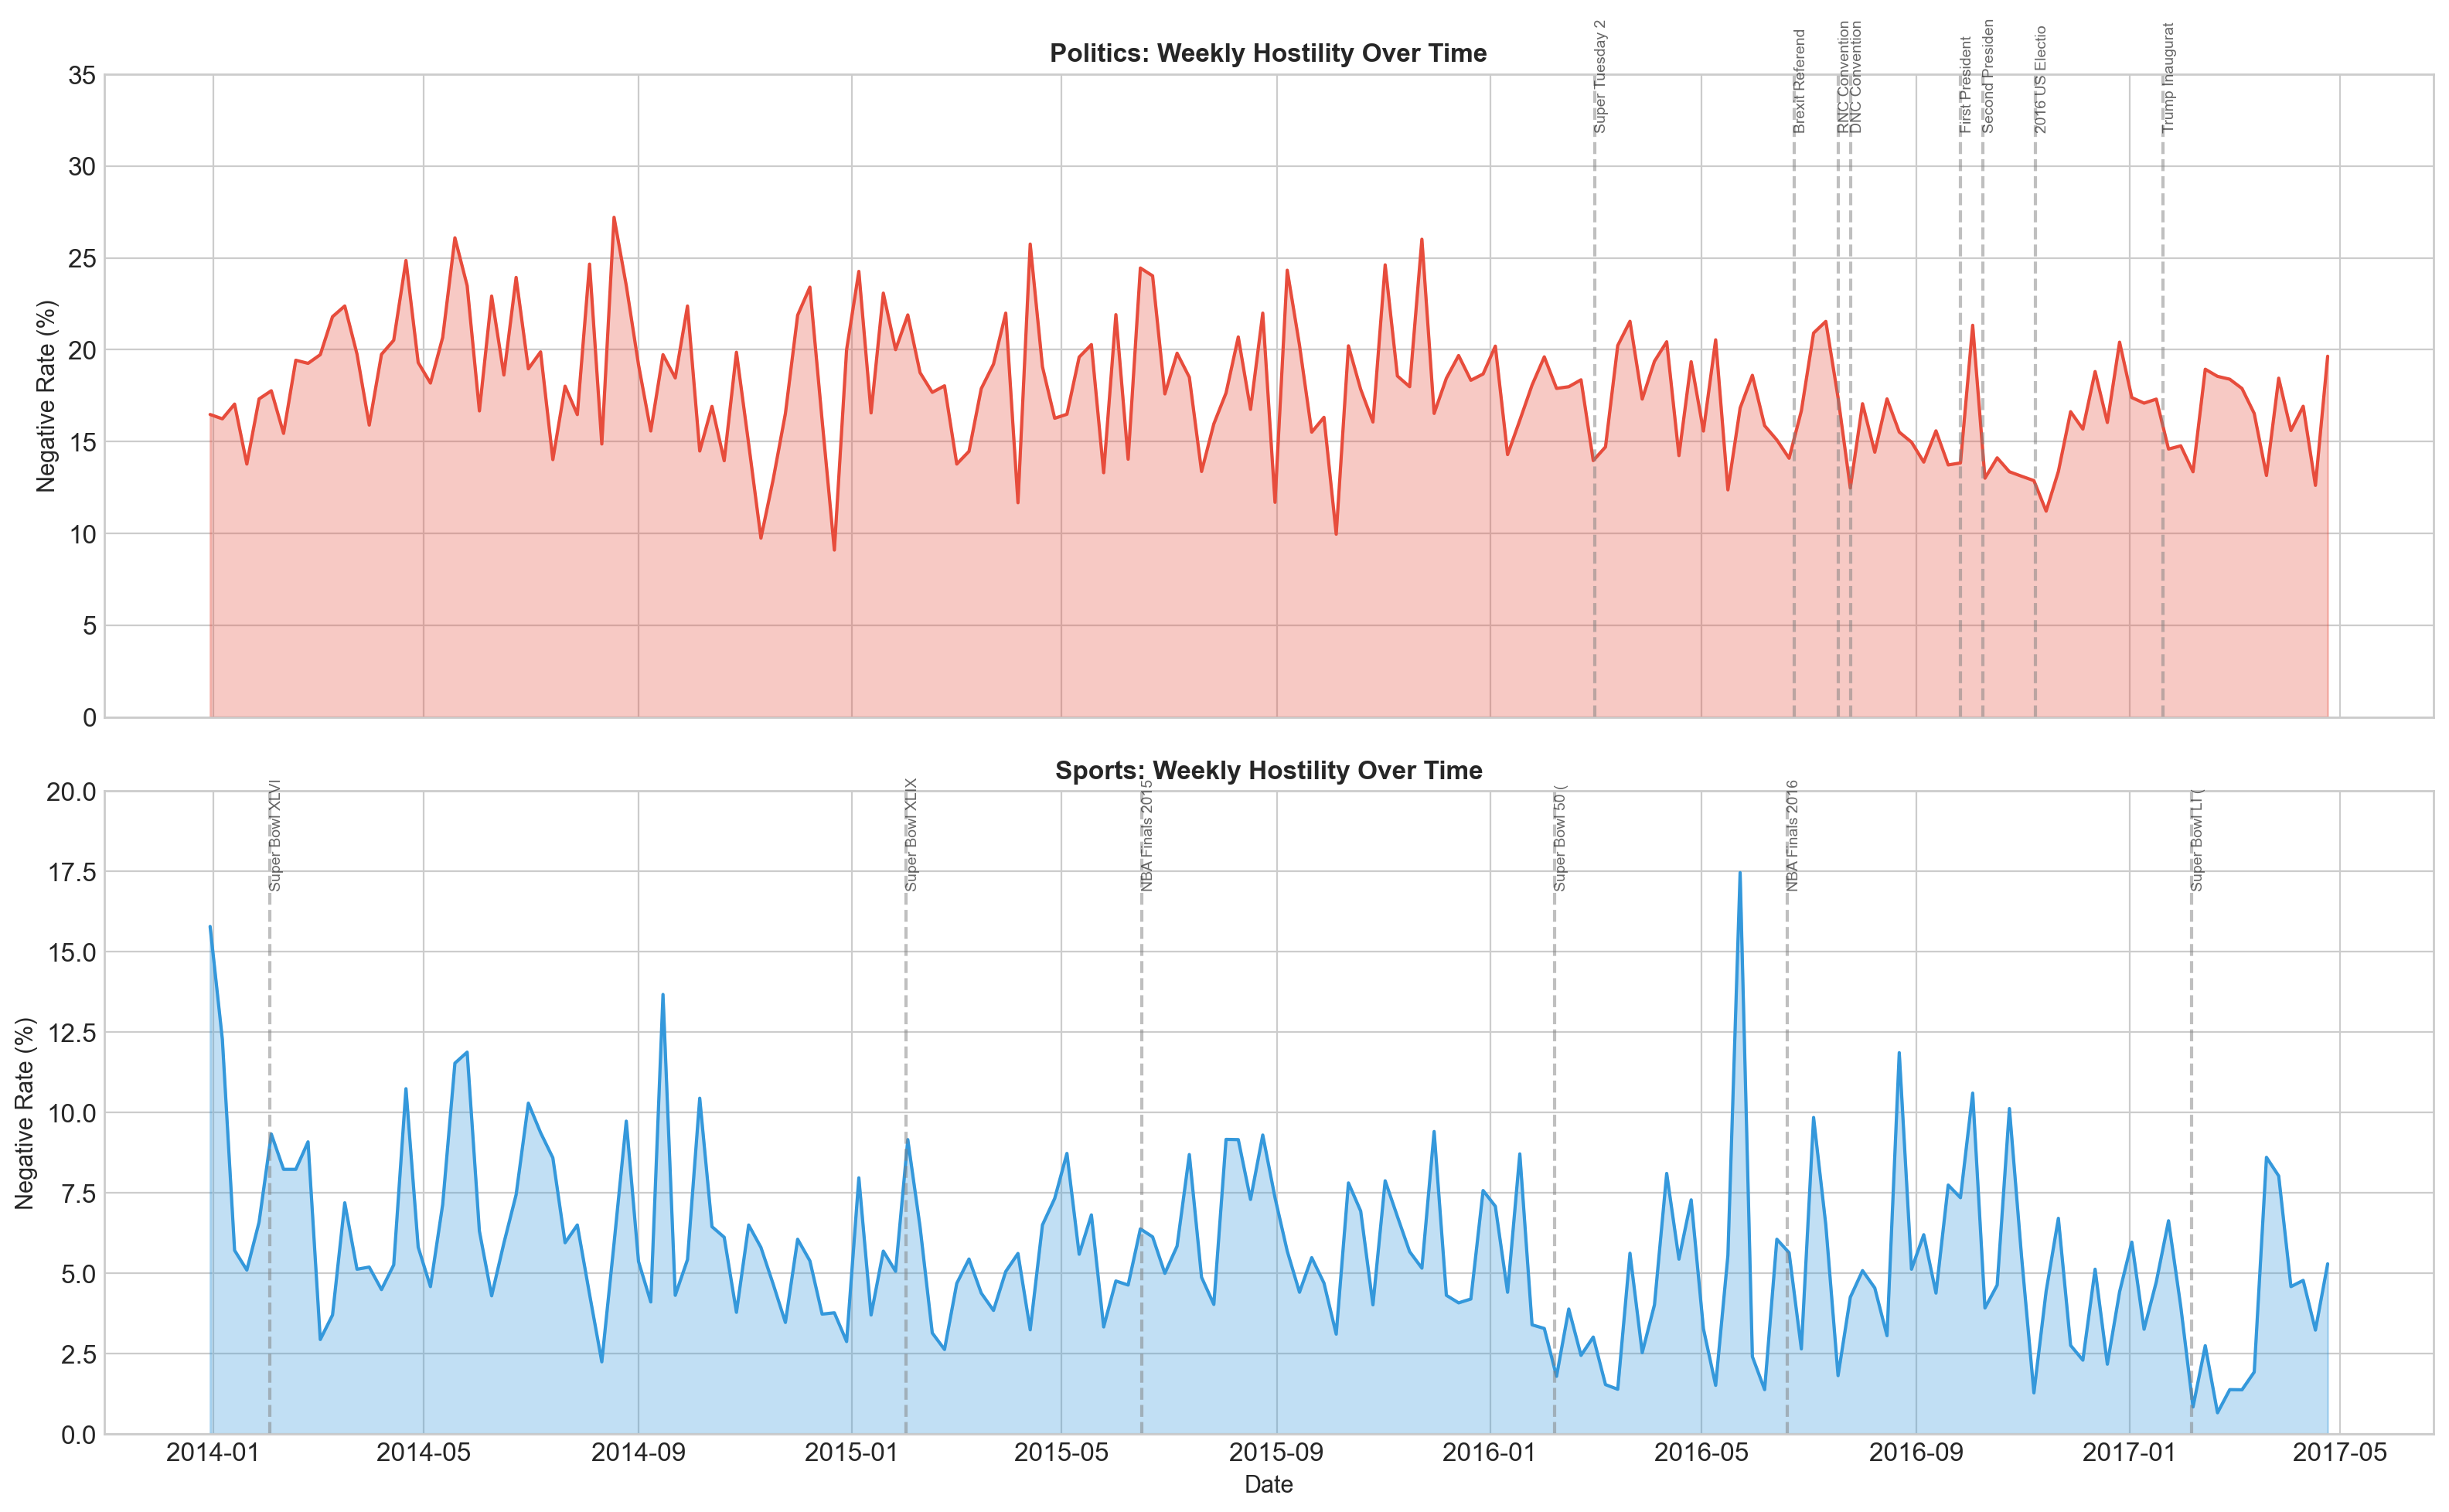
Does hostility change when the world shakes? We tracked major events in both domains, like the US Election and Brexit for politics, the Super Bowl and NBA Finals for sports.
The hypothesis: Politics is serious, so events should leave permanent scars. Sports is a game, so events should be fleeting.
The reality? They react exactly the same.
Timelines Visualization
What the charts show
Across both domains, the baseline level of hostility stays surprisingly stable over time, but major events act like short-lived accelerants. During the week of an event, hostility can jump dramatically, and then (crucially) fall back toward its usual level afterward.
In our event study, we compared hostility in the week before each event to hostility during the event window. Here are the biggest shocks we observed:
| Event | Domain | Baseline (pre-event) | During event | Change |
|---|---|---|---|---|
| Super Bowl LI (Patriots vs Falcons) | Sports | 2.2% | 10.3% | +8.2 pp |
| Brexit Referendum | Politics | 14.3% | 20.5% | +6.2 pp |
| NBA Finals 2016 Game 7 | Sports | 5.0% | 10.5% | +5.5 pp |
| Second Presidential Debate | Politics | 17.7% | 22.9% | +5.2 pp |
| Super Bowl XLIX (Patriots vs Seahawks) | Sports | 6.8% | 11.1% | +4.3 pp |
| Trump Inauguration | Politics | 15.8% | 19.4% | +3.6 pp |
But events don’t always raise hostility. Some of the “headline moments” actually coincided with calmer cross-community linking:
| Event | Domain | Baseline (pre-event) | During event | Change |
|---|---|---|---|---|
| Super Tuesday 2016 | Politics | 16.0% | 6.1% | −9.9 pp |
| Super Bowl XLVIII (Seahawks vs Broncos) | Sports | 8.3% | 0.0% | −8.3 pp |
| DNC Convention Start | Politics | 15.2% | 10.1% | −5.0 pp |
The Key Points
- Spikes are real: when an event polarizes attention, people cross subreddit borders to dunk on opponents (or rivals) more often.
- But they don’t “rewrite” the culture: we don’t see evidence of permanent scars, hostility tends to snap back toward baseline.
- Sports can swing harder than politics: the largest jumps in negativity were actually triggered by sports championships (especially Super Bowls), likely because outcomes are immediate and emotionally charged.
The universal signature
We finally arrive at our central question: is the hatred the same?
To answer this, we analyzed the “linguistic signature” of hostility. We looked at 67 psychological and linguistic features (using LIWC) to see how people write when they are being hostile versus when they are being neutral.
If political anger is ideological and complex, and sports anger is simple and tribal, their signatures should look different.
We found that they don’t. They are nearly identical.
We treated hostility like a forensic trace: first we measured how often it appears, then what it looks like in language, then we asked whether that “signature” is portable across domains, and finally whether the same forces also show up at the level of events and network structure.
Instead of betting everything on one metric, we built a chain of evidence that checks the same claim from multiple angles:
Proportion tests & effect sizes
"Is politics really bloodier?"
We started with the simplest question: how often do hostile links occur?
We compared the proportion of hostile hyperlinks (LINK_SENTIMENT = -1) in Politics vs Sports using a two-proportion test (χ² / z-test), reported a 95% confidence interval for the difference, and quantified how big the gap is with Cohen’s h, plus risk ratio and odds ratio.
This is the “frequency layer”: it tells us how much conflict there is, not yet how it sounds.
LIWC hostility signatures
"What does hostility sound like?"
Next, we built a linguistic fingerprint for each domain.
For every LIWC feature, we computed a delta between hostile and non-hostile posts:
signature(feature) = mean(feature | hostile) − mean(feature | non-hostile)
This produces one “signature vector” for Politics and one for Sports.
We then compared the two vectors with Pearson (shape similarity) and Spearman (rank similarity) correlations.
If hostility is domain-specific, these fingerprints should diverge. If it’s universal, they should line up.
Bootstrap & permutation tests
"Is the resemblance real, or just luck?"
: “Is the resemblance real, or just luck?”
A strong correlation can still be a coincidence if the sample is weird.
So we stress-tested the signature similarity:
- Bootstrap CI (n=2000): resample posts and recompute the correlation → gives an uncertainty band around r.
- Permutation test (n=2000): shuffle feature alignments to simulate chance → tells us how extreme our observed r is under randomness.
This is our “robustness layer”: we make sure the resemblance isn’t a fragile artifact.
Cross-domain classifier transfer
"Can a model trained on Politics recognize Sports?"
Similarity on a plot is one thing; portability is stronger.
We trained a logistic regression on LIWC features to predict hostility in one domain, then tested it as-is on the other:
- train on Politics → test on Sports
- train on Sports → test on Politics
We evaluated with AUC (Area Under the Curve).
If hostility has a different meaning across domains, transfer should collapse toward 0.5. If the signal is shared, AUC should stay high.
Logistic regression coefficient comparison
"Do the same features do the work?"
Even when two models perform well, they might rely on different cues.
So we compared the mechanisms of the Politics and Sports classifiers:
- Coefficient correlation: do features get similar weights?
- Sign agreement: do features push hostility in the same direction?
- Top-feature overlap: do the strongest predictors match?
This is the “interpretability layer”: it tells us whether the same linguistic levers are being pulled.
Difference-in-differences + network metrics
"Do events and structure tell the same story?"
Finally, we zoomed out from language into dynamics and structure.
- Difference-in-differences (events): for major shocks (elections, finals, referendums…), we compared the change in hostility for “involved” camps versus “less involved/observer” camps, before vs during the event window. This isolates event effects from normal baseline fluctuations.
- Network metrics (structure): we model camps as a directed network where edges carry hostile-link flow. We then summarize behavior with metrics like density (how connected the conflict is), reciprocity (do attacks get returned?), and aggressor/target patterns via outgoing vs incoming hostility.
Together, these checks cover the full following stack. When all six layers agree, we can say it with confidence: the topic changes, the script of hostility doesn’t.
What we found (and why it matters)
The resemblance is not subtle, it’s statistically overwhelming.
A Pearson correlation of r = 0.937 between the Politics and Sports signatures means that when a feature increases during political hostility, it almost always increases during sports hostility too (and vice versa). In other words: the same “psychological knobs” get turned.
And the social-psychology “tell” is the same in both arenas: THEY goes up. Hostile posts are less about “us” and more about labeling and attacking them.
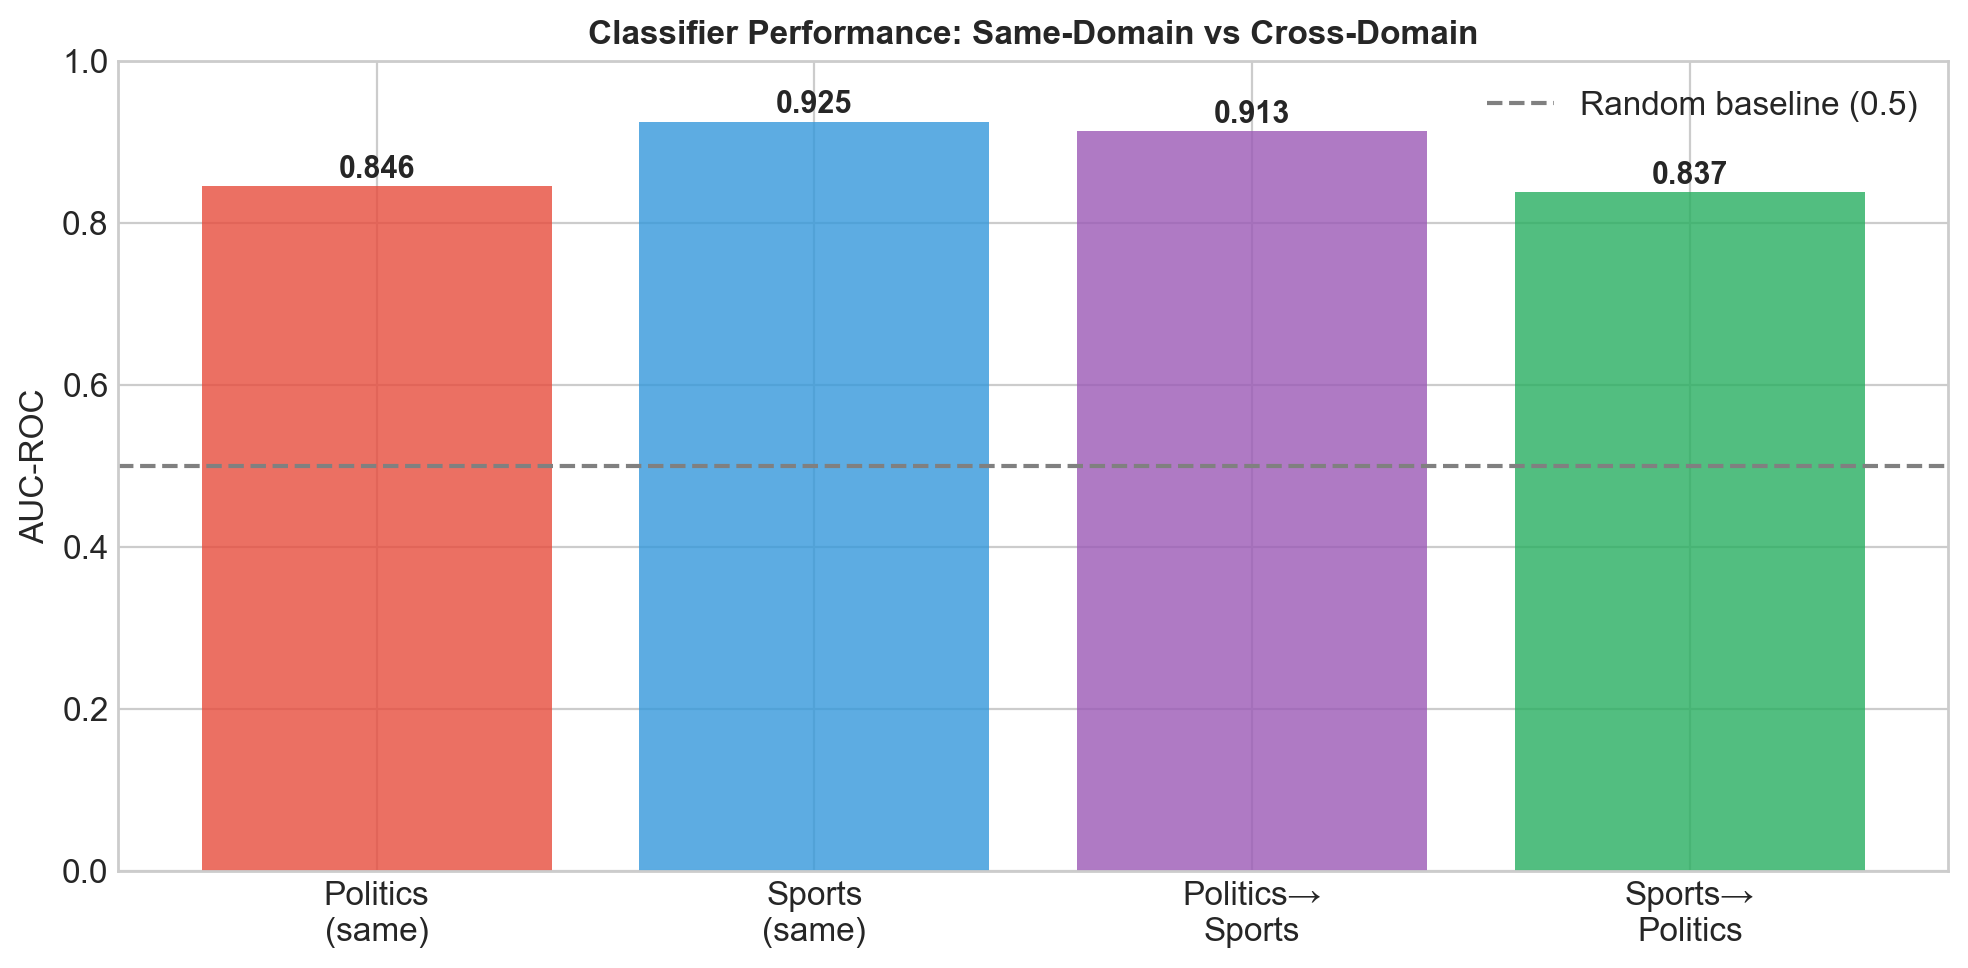
It transfers: the model trained on one domain recognizes the other
Cross-domain classifier transfer was strikingly strong:
- Politics → Politics: AUC = 0.846
- Sports → Sports: AUC = 0.925
- Politics → Sports (transfer): AUC = 0.913
- Sports → Politics (transfer): AUC = 0.837
These AUC scores are far above the random baseline of 0.5, meaning the same feature patterns generalize cleanly across topics.
The “why” matches too: coefficients align
When we compared logistic regression coefficients between domains, they still matched:
- Coefficient correlation: r = 0.876
- Sign agreement: 73.5% of features point in the same direction
- Top-10 overlap: 7/10 most important features are shared
So it’s not just that hostility looks similar in aggregate, it’s built from the same parts.
And it’s robust: uncertainty is tight
We bootstrapped the correlation to quantify uncertainty:
- Bootstrap 95% CI: [0.880, 0.972]
- Permutation test p-value: ~0.0000
Even the lower bound of the confidence interval still implies a very strong relationship. This is not an artifact of sampling noise.
Statistical validation (for the skeptics)
| Claim | Metric | Value |
|---|---|---|
| Politics is more hostile than sports | Hostility rate | 17.3% vs 5.2% |
| Size of the gap | Difference (pp) | 12.10 pp (95% CI: [11.65, 12.55]) |
| Significance | χ² test | p < 0.001 |
| Effect size | Cohen’s h | 0.398 (medium) |
| “Hostility sounds the same” | Signature correlation | r = 0.937 |
| Robustness | Bootstrap CI | [0.880, 0.972] |
| Not due to chance | Permutation p | ~0.0000 |
| Transfer works | Cross-domain AUC | 0.913 (Pol→Sport), 0.837 (Sport→Pol) |
| Same features matter | Coef correlation | r = 0.876 |
The verdict
Our investigation reveals four undeniable truths about the nature of the conflict:
-
Anger is universal: politics is a bloodier battlefield (3.3x more hostile), but the soldiers use the exact same weapons. The linguistic signature of conflict is identical (r = 0.937), proving that hostility is a fundamental human instinct, not a topic-specific reaction.
-
Hate is portable: the patterns are so consistent that a machine trained to spot political vitriol can instantly recognize sports trash-talk. The DNA of abuse is shared, suggesting that moderation tools could work across any domain.
-
Events are just noise: shockwaves like the Super Bowl or the Election cause massive, temporary spikes in rage (up to +8%) and activity, but the dust always settles. Hostility is a stable trait of the community, not a bug caused by the news cycle.
-
The watchers are warriors: perhaps most surprisingly, “meta” communities built to observe drama (e.g. r/SubredditDrama) are among the most hostile places of all (~25%). It turns out that pointing fingers at a fight is just another way of throwing a punch.
In the end, the data suggests something primal. When we enter the arena of subreddit conflicts, we shed the nuance of the topic and revert to a universal script. Whether defending a policy or a quarterback, the way we attack the “other” is predictable, consistent, and fundamentally human.
The topic changes. The expression of hate remains the same.
Here’s a bonus animation we did for the fun!