The Evolution of Gender and Ethnic Representation in Cinema
Analyzing diversity trends in the film industry
Motivation
The evolution of gender, ethnic and other apparent physical features representation in cinema serves as a lens reflecting societal values and cultural shifts over decades. In this project, we seek to explore these dynamics by analyzing the physical characteristics of main actors—gender, ethnicity, sexual orientation, height, and age—across decades and genres, using the CMU movie summary corpus as our main data source. Together, we will investigate how specific archetypes emerge, evolve, and influence genre conventions and movie revenues, shedding light on diversity’s role in shaping audience engagement and the movie industry in general.
By examining trends in character archetypes in the movie industry, we aim to identify shifts in societal norms and values, allowing us to better understand the role of cinema in mirroring and potentially driving cultural changes.
Introduction
Hello reader,
Do you know that 5 out of 4 people struggle with math?
…Wait, what?!
While this joke has nothing to do with the project, something curious happens as you read this text. You probably hear a voice in your head—don’t worry, that’s just me, your narrator. I am here to guide you through this data story, where every number and insight reveals a new chapter. Follow me, I will be your tour guide.
Let me brief you first : Did you notice that in today’s movies, we see more and more characters representing diverse ethnicities, sexual orientations, gender identities, and physical features?
The growing number of movies and TV shows featuring LGBTQ+ characters, diverse ethnicities, and varying gender identities reflects a significant shift in societal attitudes. The modern audience, especially younger generations (Millennials and Gen Z), demand inclusivity and are willing to support films that reflect diverse experiences. And the movie industry understood the assignment! According to a 2018 McKinsey & Company study and subsequent reports from the USC Annenberg Inclusion Initiative, movies with diverse casts consistently outperform those with less representation. In fact, films with casts that are 41–50% diverse earned, on average, $26.8 million more in global box office revenue compared to those with less than 11% diversity.
Thankfully, today’s society is more open and inclusive, embracing stories that represent a broader spectrum of human experiences. But was it always the case?
Obviously not! Fifty or sixty years ago, representation of LGBTQ+ characters, racial diversity, and non-conforming gender identities in movies was far less common—and often met with strong resistance. Societal norms, censorship, and prejudices limited the stories that could be told and the characters that could be represented. In the United States, the Hays Code (1934–1968) regulated movie content, prohibiting explicit depictions of sexuality, “immoral” behavior, and any form of homosexuality, which was labeled as “sexual perversion.” As a result, LGBTQ+ characters were either omitted, villainized, or their identities were subtly implied through coded language or stereotypes.
By using movie revenue as a metric to assess how well a movie was received by the public, we aim to analyze the archetypes of characters portrayed in successful movies, shedding light on the audience’s evolving interests and preferences, and thus offering insights into how societal norms and perceptions have shifted over the years.
A few words on our analysis
You’ve probably figured it out by now: our study relies heavily on movie revenue to uncover trends. And yes, I can already hear the criticism coming from miles away: “But how can you compare movies from different eras? You need to adjust for inflation and time value of money!”
Relax, nerds, we’ve got you covered. To ensure our analysis is solid, we split the data into smaller time frames (5 years each). This allows us to draw meaningful conclusions while conveniently sidestepping the pesky effects of inflation and the changing value of money over time.
Alright, let’s get serious for a moment. Your concern is completely valid: by computing the Pearson correlation between movie revenue and release year, I found a correlation of 0.19, meaning that movie release date HAS an influence on revenue. This observation is made obvious simply by looking at the graph of average movie revenue per year - as recent movies tend to generate significantly higher revenues :

While such an increase can be explained by democratization of cinema over the years, time value of money also plays an important role. In fact, we estimate that $100 in the early 1900’s corresponds to a purchasing power of nearly $3800 today!
In order to account for all these effects, we chose to split our analysis into 5-year periods. This approach not only helps us overcome the inflation and other time-related issues, but also allows us to detect how the impact of each of our features (gender representation, ethnic representation, movie genre, etc.) on movie revenue evolves over time—because, as we’ll see, their influence isn’t static; it changes with the years!
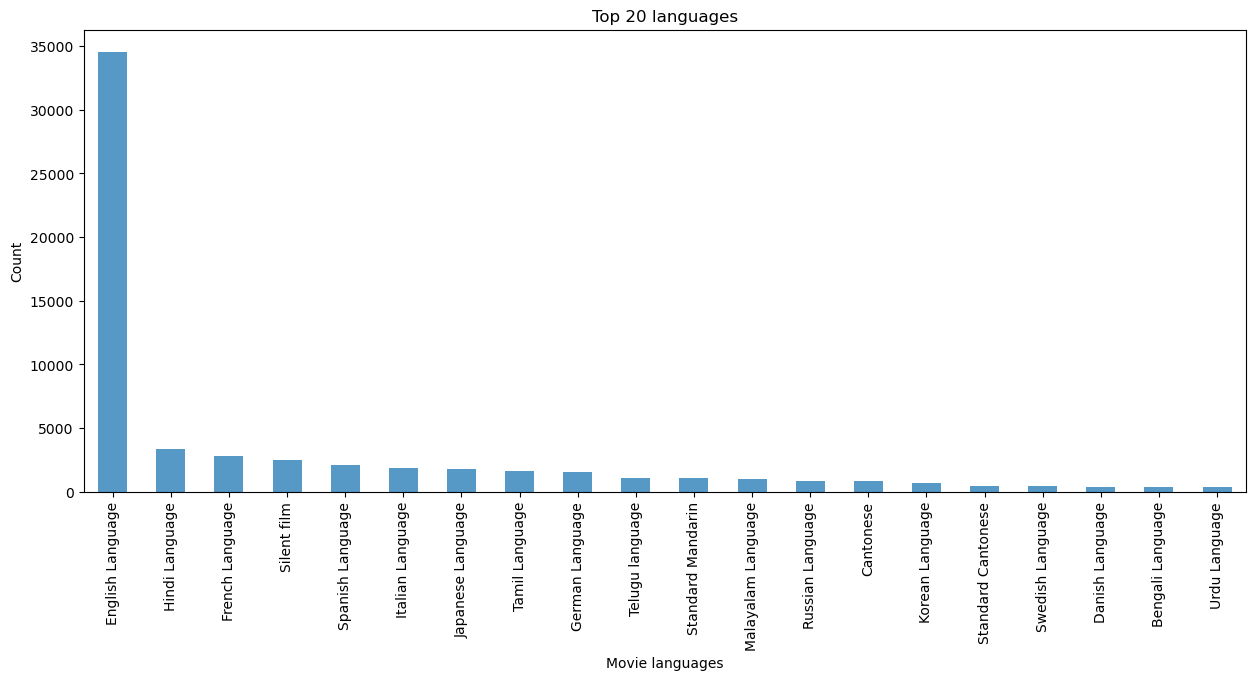
Moreover, due to data imbalance when it comes to movie release language, I decided to focus only on movies released in English (I would expect our model to fail to determine meaningful relationships between movie language and movie revenue anyways due to lack of data in some languages). WITNESS THE IMBALANCE ! 😱
Effects of Diversity on Movie Revenue
Before further diving into our story, here is a picture of Patagonia, Argentina :

Isn’t it lovely ? 🥰 While Patagonia does not have anything to do with the project, studies suggest that reader’s attention tends to fade away after 6 minutes of reading. By putting an image of beautiful Patagonia, I wanted to surprise your brain and fully reengage you in the lecture of our story! (This method was used by an amazing Statistics professor at EPFL in the undergraduate course Probabilities & Statistics, and it has proven very efficient!)
Back on the track!
In order to convince you about the importance of diversity representation in cinema, take a look at the Spearman correlation matrix I made just for you 🥰 :
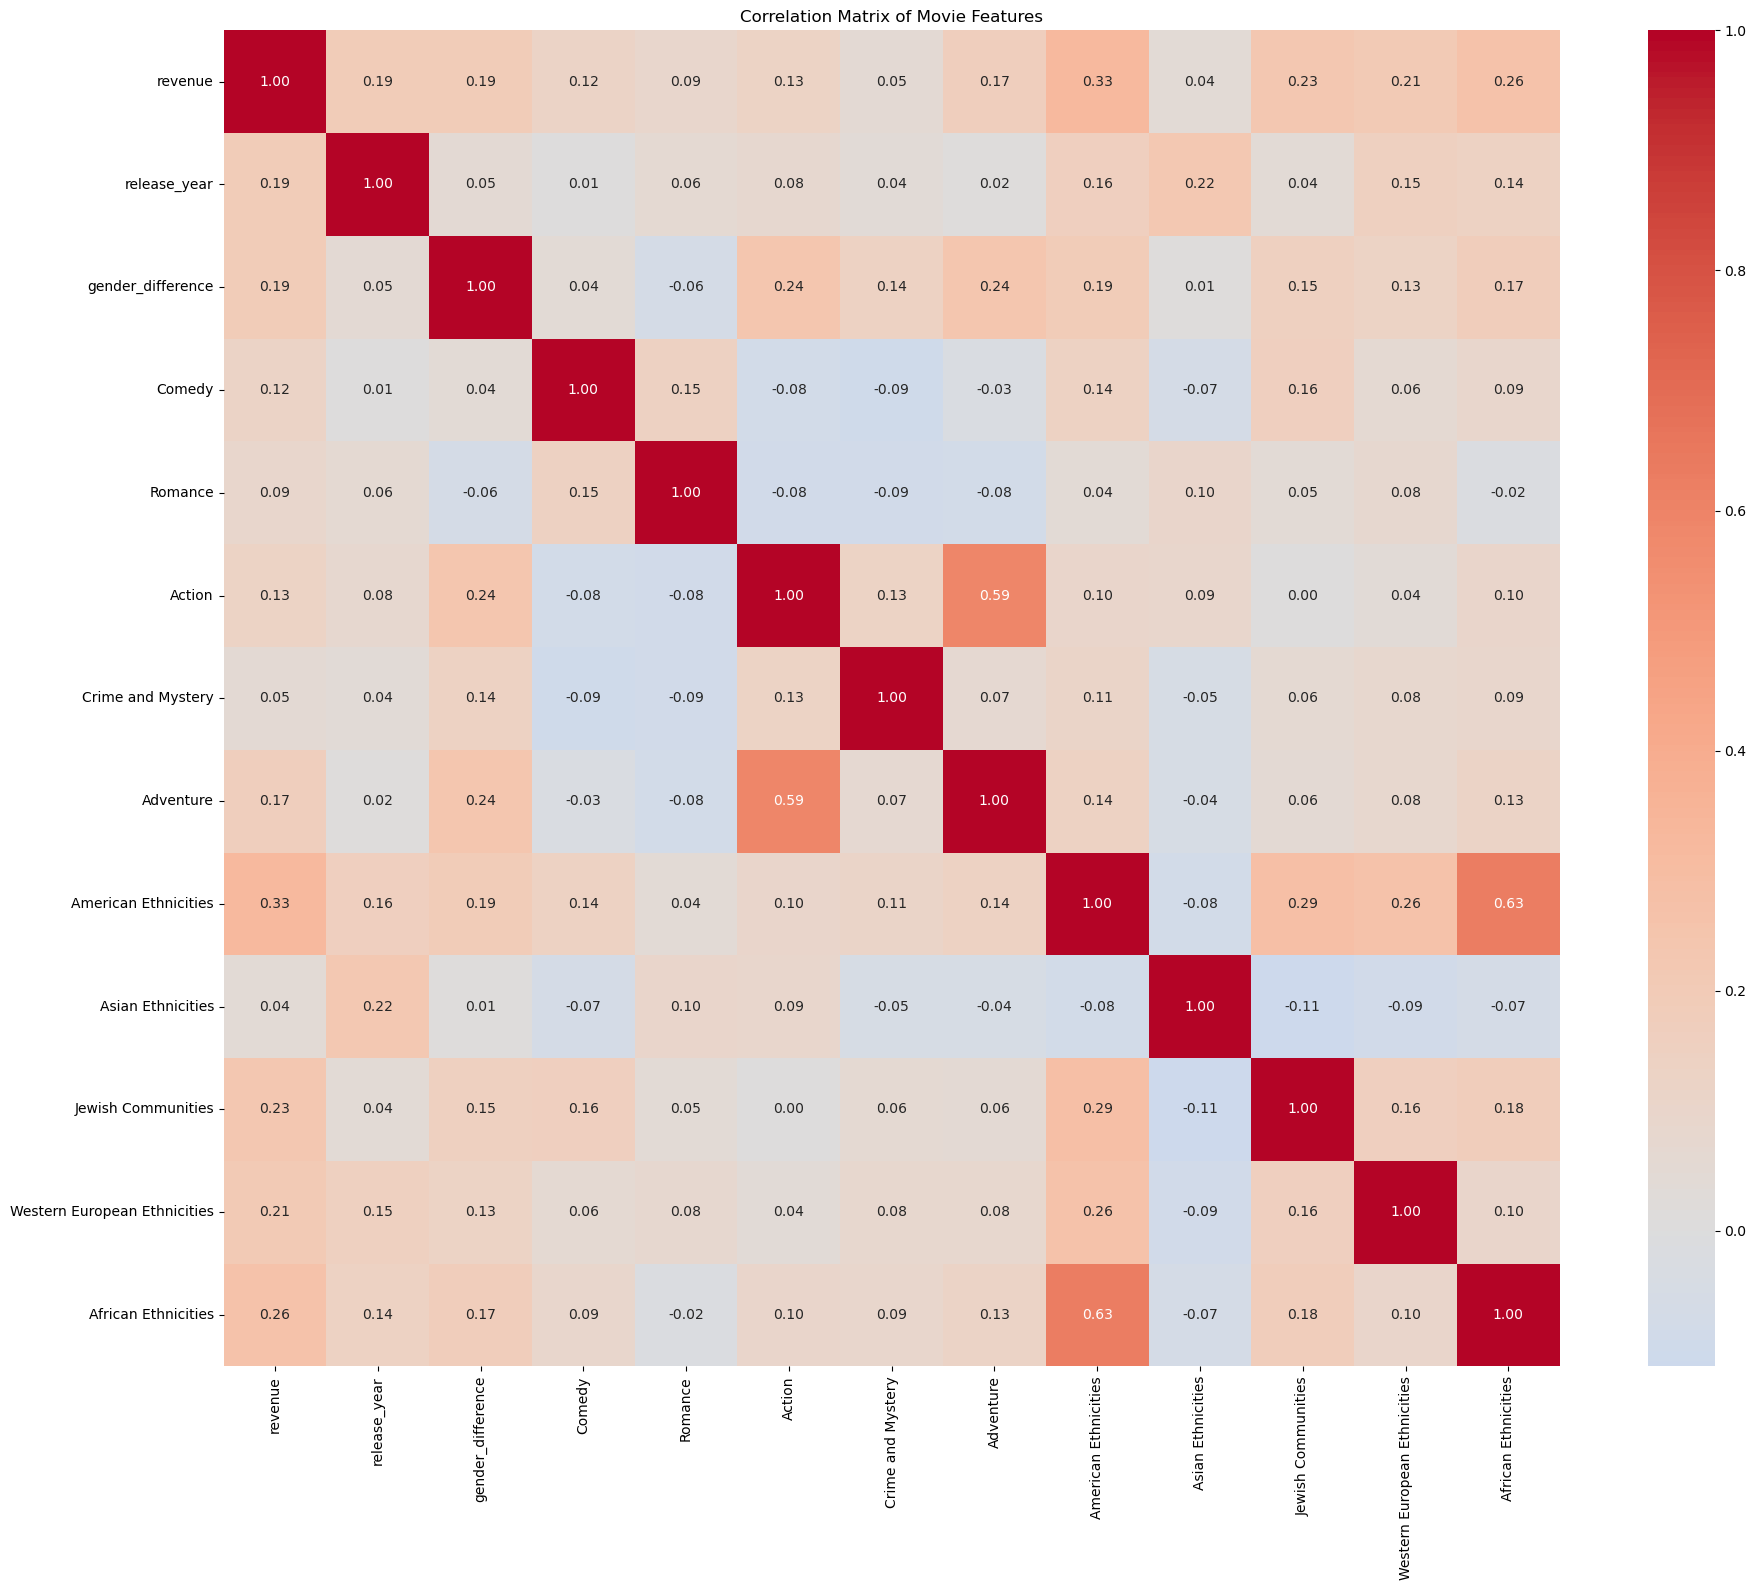
Notice anything special ? The gender ratio, as well as the presence of some ethnicities such as actors from Jewish communities or African American ethnicities are positively correlated with the movie revenue (with a Spearman correlation of 0.20 and 0.26 respectively with movie revenue). Besides, movie genres seem also to affect the movie revenue, but I kept this chapter of our story for later, so stay tuned!
Ah! Just before I forget : computing the Spearman correlation instead of the Pearson correlation WAS a choice. In fact, Spearman correlation is better suited to detect monotonic, but not necessarily linear relationships, thus providing more robust results. “robuster”? “more robust”? Well , you get the idea.
How does the ratio of female actresses in the movie cast influences the revenue ?
🎵Roses are red, Violets are blue 🎶 The ratio of female has an influence on the movie revenue !
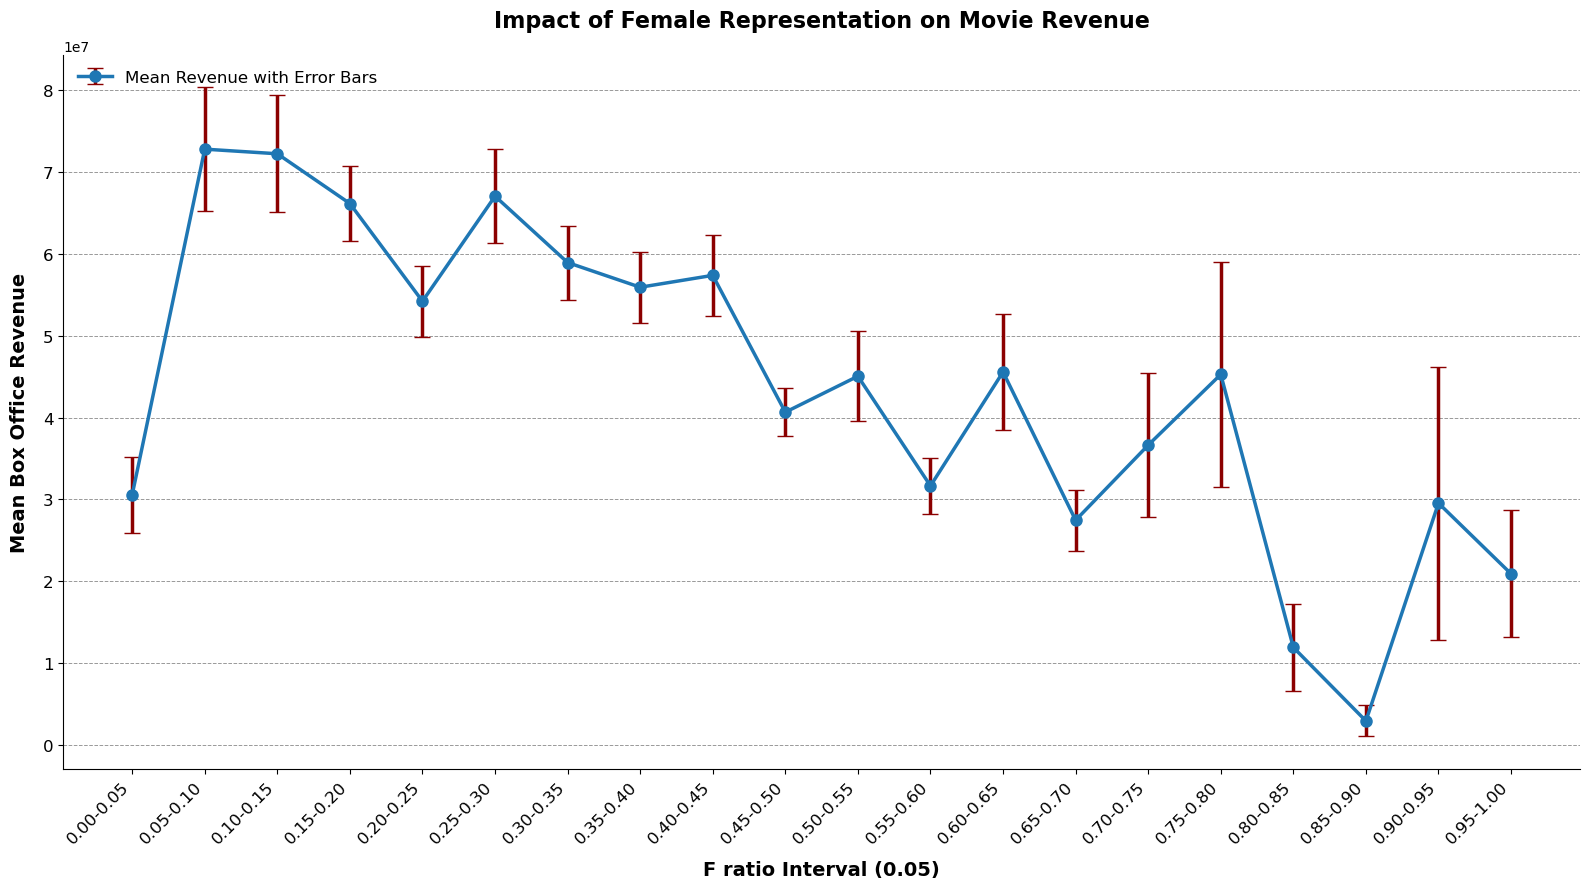
According to our analysis conducted on the entire dataset (i.e. without accounting for time dependent trends), it appears that while too many female actresses (in proportion) in a movie cast is not good for the overall revenue, not having enough (too few!) is also very bad!
This reveals a lot about the depiction of women in cinema and, by extension, broader societal norms. The fact that having “too many” female actresses negatively impacts revenue suggests that Hollywood (since we only considered movies in english)—and audiences—view women as secondary characters, rather than leads driving the story. It reflects a bias where female representation beyond a certain threshold is seen as deviating from the “norm,” which has long been dominated by male-centric narratives.
On the other hand, the sharp drop in revenue when there are too few women highlights an expectation for female presence, likely as a means of fulfilling traditional or stereotypical roles—love interests, sidekicks, or supporting characters—rather than as central, multi-dimensional figures. In short, this trend underscores a lingering imbalance: while cinema and society have accepted a certain level of female representation, it remains confined within limits that align with historical gender roles. Breaking these boundaries would require challenging deeply ingrained perceptions of who gets to be at the forefront of storytelling.
What about the revenue per ethnic group ?
Now that we’ve explored gender, let’s turn to another key question: what about revenue across ethnic groups? Are certain ethnicities more prominently featured in box office hits? As you might guess, the data speaks volumes—so let’s take a closer look at how revenue aligns (or doesn’t) with the representation of different ethnic groups on screen.
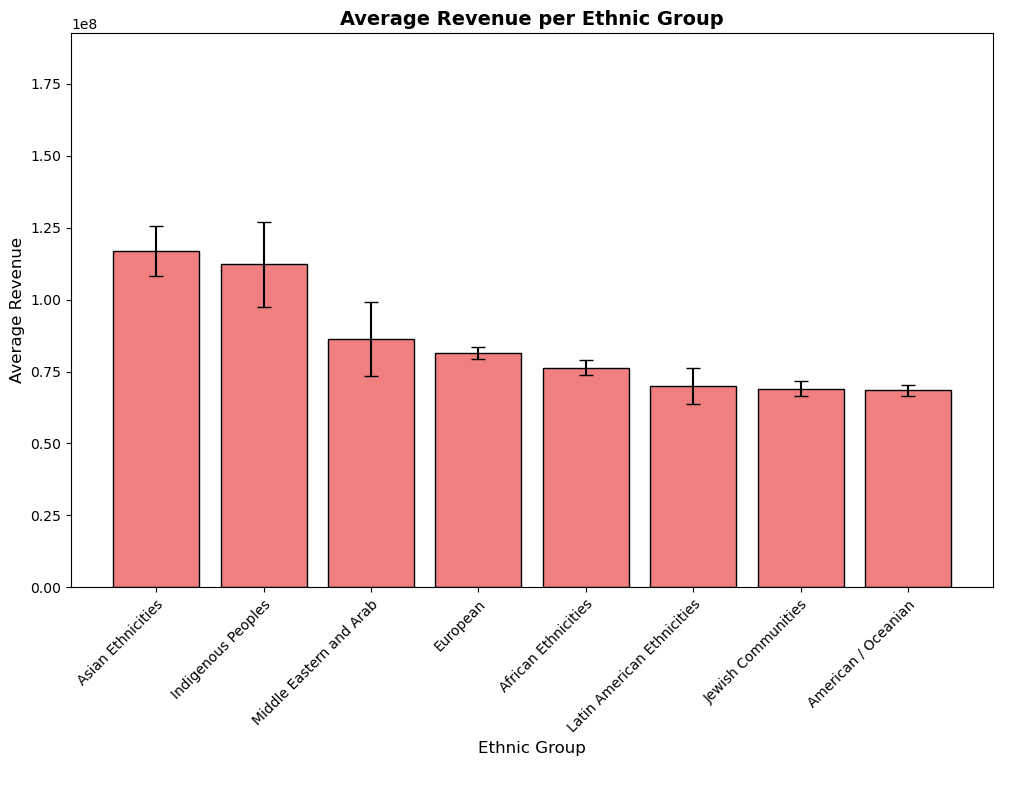
The plot reveals a relatively balanced average revenue per ethnic group, with some minor variations. Movies featuring Asian ethnicities and Indigenous Peoples perform slightly better, leading the chart in average revenue. This could be attributed to the growing appeal of Asian markets and the global reception of culturally significant or unique stories. Meanwhile, groups such as Middle Eastern and Arab, European, and African ethnicities fall closely behind, showing only small differences in average earnings.
Overall, the revenue distribution across ethnic groups appears fairly consistent, with no striking imbalance. This suggests that movies featuring diverse ethnicities have similar earning potential, reflecting openness among audiences to embrace and engage with stories representing a variety of cultures.
And for the revenue per movie genre ?
Are all genres created equal when it comes to box office success, or do some consistently outshine the rest? From action-packed blockbusters to heartfelt dramas, let’s explore which genres bring in the big bucks and which ones struggle to capture audiences’ wallets—and hearts.
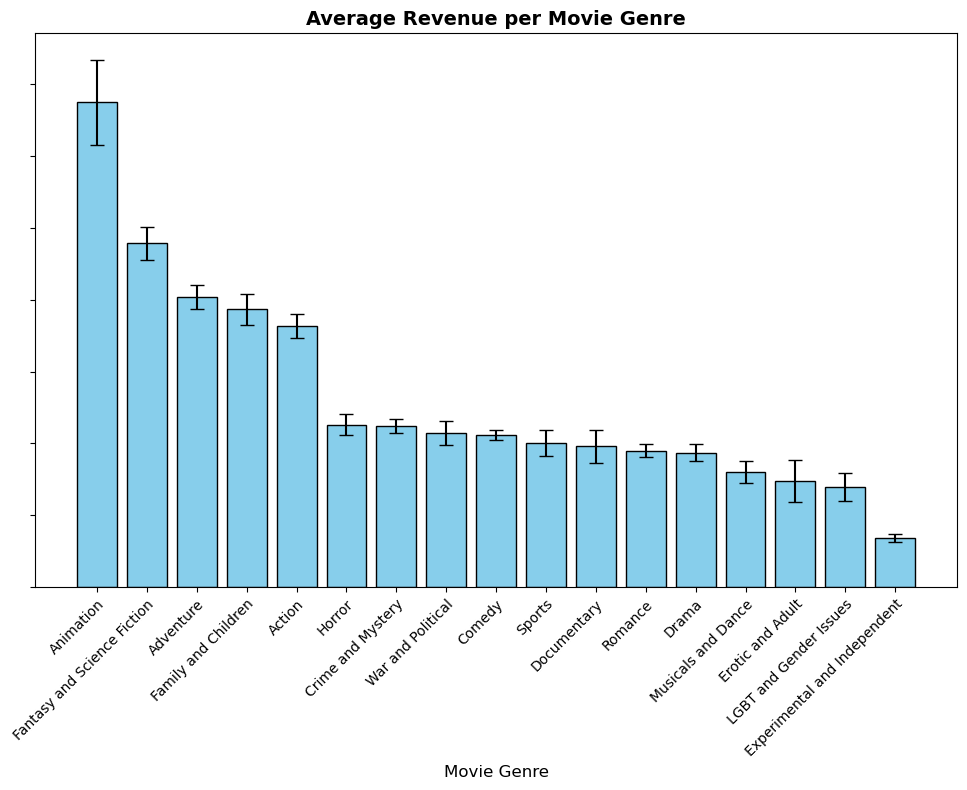
Wow, well that’s surprising! At the very top, Animation absolutely dominates, raking in the highest average revenue—no surprise there, given its universal appeal, family-friendly nature, and blockbuster franchises that pull in audiences worldwide.
Close behind, we see Fantasy and Science Fiction, Adventure, and Family and Children genres thriving, powered by big budgets, epic storytelling, and dedicated fanbases.
But here’s where it gets interesting: genres like Drama, Musicals and Dance, and LGBT and Gender Issues sit much lower, suggesting that despite their critical acclaim or cultural importance, they struggle to compete financially. And at the very bottom, Experimental and Independent films bring in the least revenue—no shock, but still a reminder of the uphill battle smaller, niche films face.
An explanation for this observation—and one we’ll explore in more detail later—is that some genres, such as LGBT and Gender Issues, have only recently gained traction and popularity. For much of cinema history, they may have struggled to draw audiences, partly due to a social climate that was less open to their themes or narratives. As societal attitudes evolved, these genres began to find their place, but their earlier struggles are still reflected in their lower average revenues.
All in all, it’s clear that when it comes to revenue, big, bold, and visually immersive genres steal the show, leaving the quieter categories fighting for their share of the spotlight.
Evolution of Trends in the movie industry and what they reflect on society
We spoke bulk, now let’s speak trends!
To further analyze the impact of gender representation, ethnic representation, and movie genres on movie revenue across the years, we ran multiple Ridge regressions while focusing on the statistically significant features with highest effect on the movie revenue (at the 5% significance level). Recall that we use movie revenue as a proxy that measures what the audience likes to see, and thus mirrors social and cultural trends in society! 🤓
To account for potential non-linearity caused by time dependence (e.g., a feature that strongly influenced revenue in 1900 may not have the same effect in 2000), we segmented our data into 5-year time periods. This approach allows us to capture how the influence of these features on movie revenue evolves over time.
The plots below showcase the top 5 most influential features with a positive effect on the revenue for movies released since 1985, providing insights into the key factors driving box office performance during that specific period.
Movie Genre trending success across time
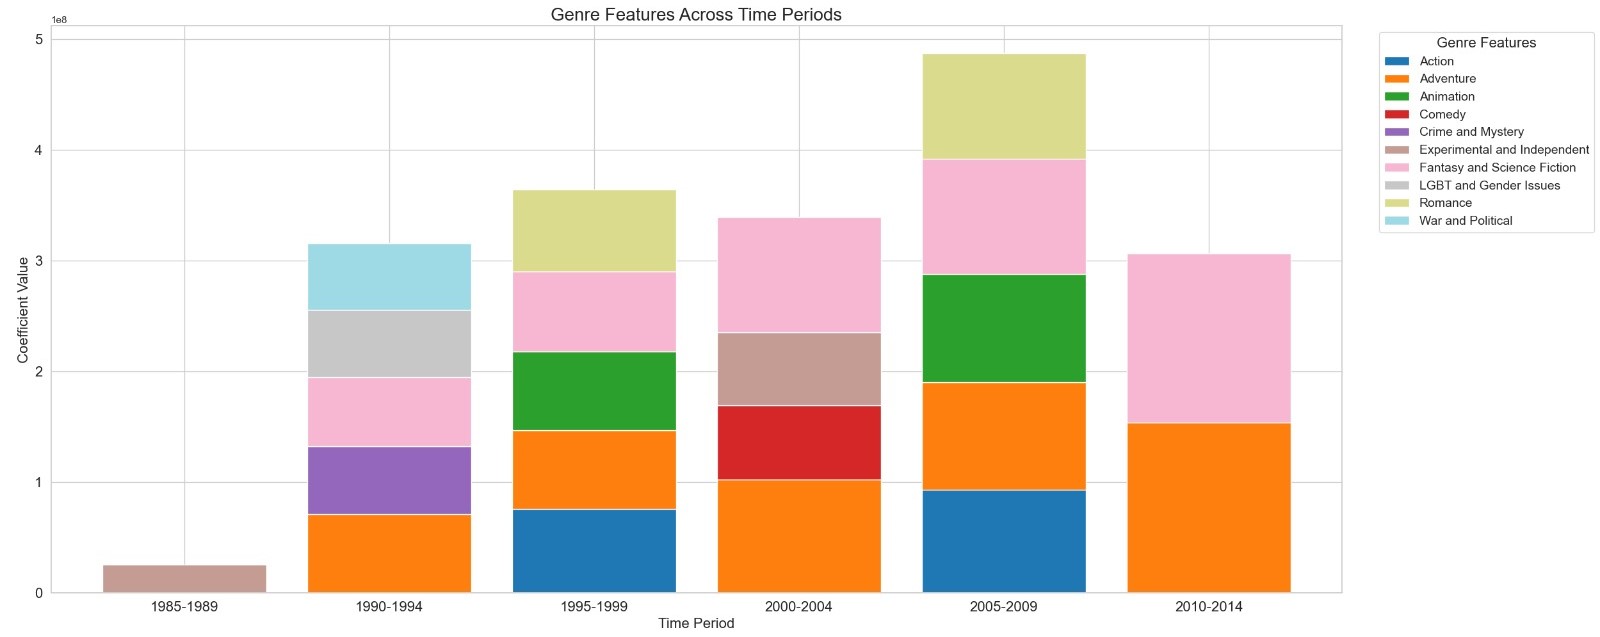
Notice some trends? Well, we do! In fact, while science fiction,adventure and romance movies seem to have gained long-lasting popularity in recent years, new themes have also stood out and grown in popularity during specific time frames.
Interestingly, a somewhat thought-provoking trend can be observed in the 1990s, where movies exploring themes of politics and war found remarkable success, just as the world was emerging from the Cold War.
Another amusing trend appears to be the popularity of movies showcasing the LGBTQ+ community by the end of the 20th century. While LGBTQ+ representation remained controversial at the time (as one can notice during the AIDS/HIV crisis between 1980 and 1990), there was however growing advocacy for visibility and rights. From our model, we can thus infer that this societal shift and progress in cultural values has opened the door for movies that explored LGBTQ+ themes to gain wider acceptance and curiosity.
Preferred character archetype and main actor physical features evolution across time
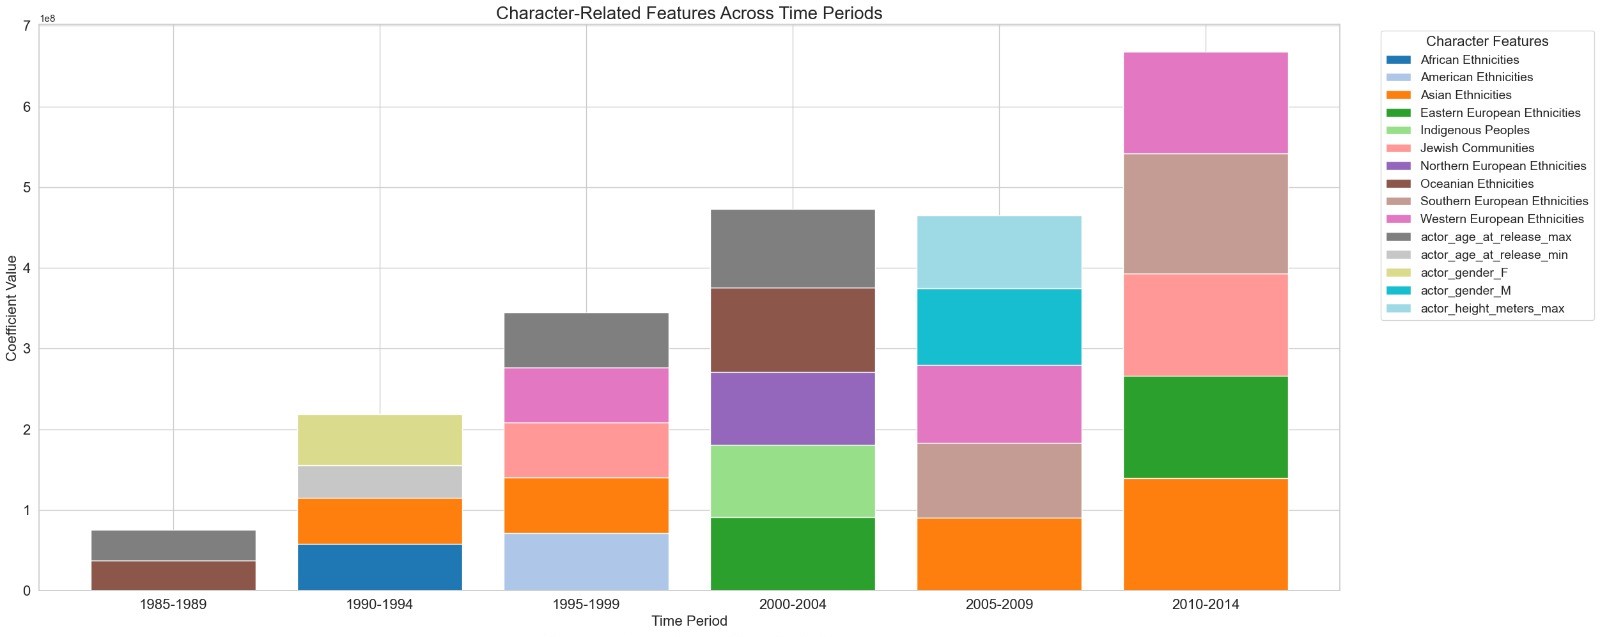
As for main characters’ features, we can notice that successful movies tend to star more actors from jewish communities since 2010. While this may be due to the performance of some very talented jewish actors starring in movies that thus generated large revenue (ie. there might be reverse causality in the model), this also indicates that the public is more open to Jewish representation in movies.
Interestingly, a similar trend can be observed regarding African ethnicities in the beginning of the 90’s, signaling a turning point in how Black characters were represented in movies. This change likely correlates with growing social movements advocating for diversity and the rising influence of Black culture in mainstream media during this time. Similar statements can be made about indigenous representation in the early 2000s.
Besides, the data also shows that white ethnicities (European and North American) tend to always remain under the spotlight.
A more global focus on diversity of characters in the movie industry
Running this time the same regressions with the ethnic score (computed as the number of ethnicities represented in movies) instead of each ethnicity represented as a feature, we get very interesting results :
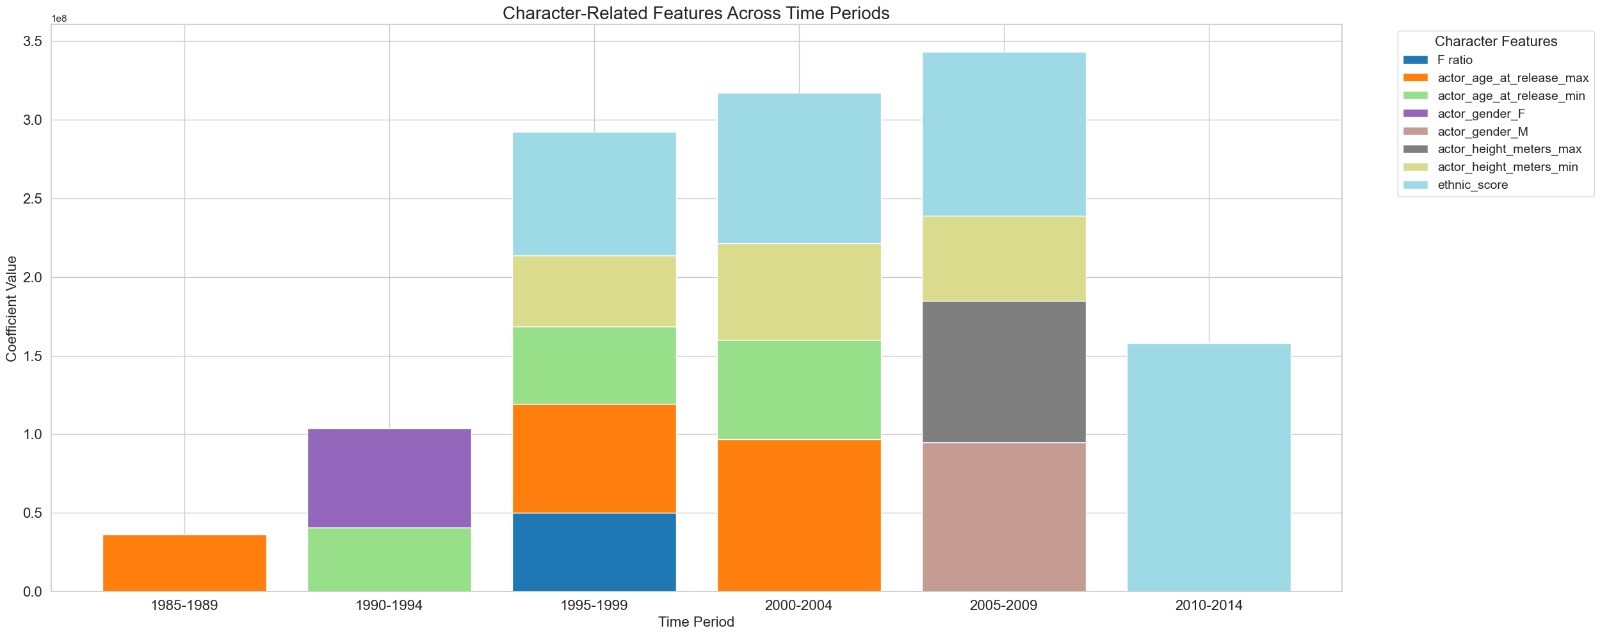
Nothing strikes you immediately? Since 1995, movies with higher the ethnic score tend to expect higher box office revenue! This result completely aligns with the McKinsey study discussed earlier, you know, the one about the influence of ethnicity on movie revenue! Perhaps those McKinsey consultants are former ADA students…
In any case, there is a reason why the effect of ethnic representation on the revenue is so strong : movies displaying more ethnicities are better received by the public, as they probably appeal to a wider audience! This clearly shows that society is evolving to embrace and celebrate a broader range of cultures and ethnicities, reflecting a growing demand for stories that resonate with diverse audiences.
Besides, the presence of female actors in the movie cast were expected to have a particularly important effect in increasing the movie revenue (and thus, movie success!) between 1990 and 1994, and during the period from 2005 to 2009. Interestingly, during these exact same periods, Romance movies showed enhanced success! This observation will be further discussed in the next chapters, yet this already says a lot about the role that women mostly play in cinema !
In particular, during year 1990-1994, the audience also seems to have shown increased interest towards younger actors (maybe younger females 🤨?!).
Our observations highlight a society that idealizes young and likely elegant women in cinema as the embodiment of femininity.
- A neglected observation? * You might be wondering : these students did not comment about the recurrent age feature! Minus one ! Well, they did, but this feature truly becomes interesting when coupled to other features such as gender. This will be further developed in the next chapter, so stay with me !
The evolution of Gender representation in the movie industry across time
We have just studied the driving factors that influence the most movie revenue during specific time frames. I hope that this first analysis gave you more insights about how the movie industry is shaped by shifts in societal trends and the desire of the public to see some communities and movie genres represented over time.
But now, let’s dive deeper in the topic, and analyze how the representation of each ethnicity, gender, and movie genre, has evolved across the years.
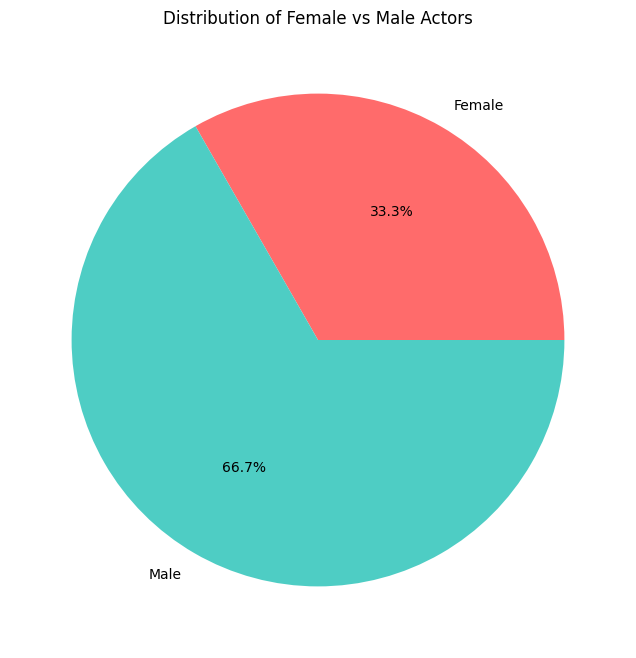
Gender representation : imbalance and misconceptions
Let’s be honest: women ARE underrepresented in the movie industry. In fact, when analyzing the overall proportion of male and female actors in the cast of each movie in our dataset, the results are striking—only about a third of the cast tends to be women. This stark imbalance highlights a persistent gender disparity in the industry.
However, a common misconception about the source of this imbalance is that older movies dataset may showcase less women in their cast, whereas the number of female actresses in movies has significantly increased over the years.
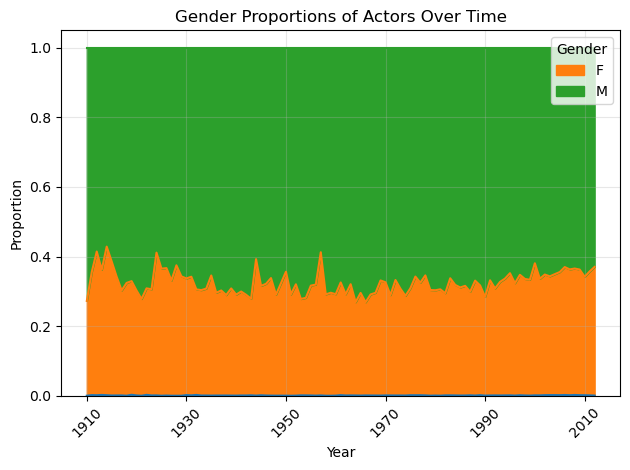
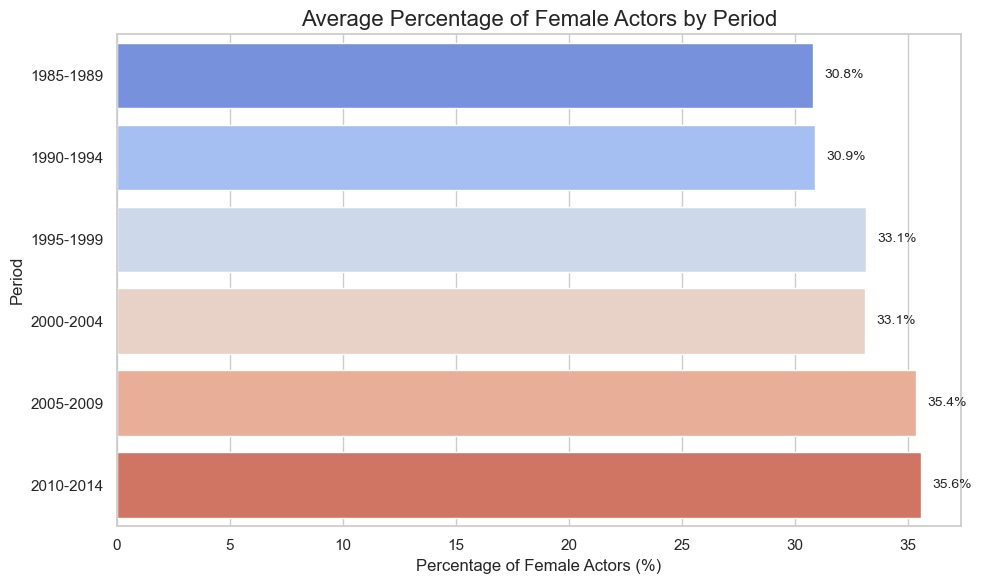
Well, that’s unexpected ! When examining the data, the proportion of female actresses has actually remained relatively stable, increasing at slow rates over the years. While there have probably been shifts in the types of roles women play and how they are portrayed, the overall representation of women in terms of sheer numbers has not seen a dramatic change, challenging assumptions about dramatic progress in gender equity in cinema.
Female representation across genres over time
Let’s now dive into an intriguing question: how has female representation varied across movie genres over time? While some genres might come to mind as more “female-friendly,” others may have historically sidelined women in favor of male-dominated narratives. Has this dynamic evolved as society’s views on gender have changed, or have certain genres stubbornly resisted progress? Let’s take a closer look! HEATMAP!!!!!!
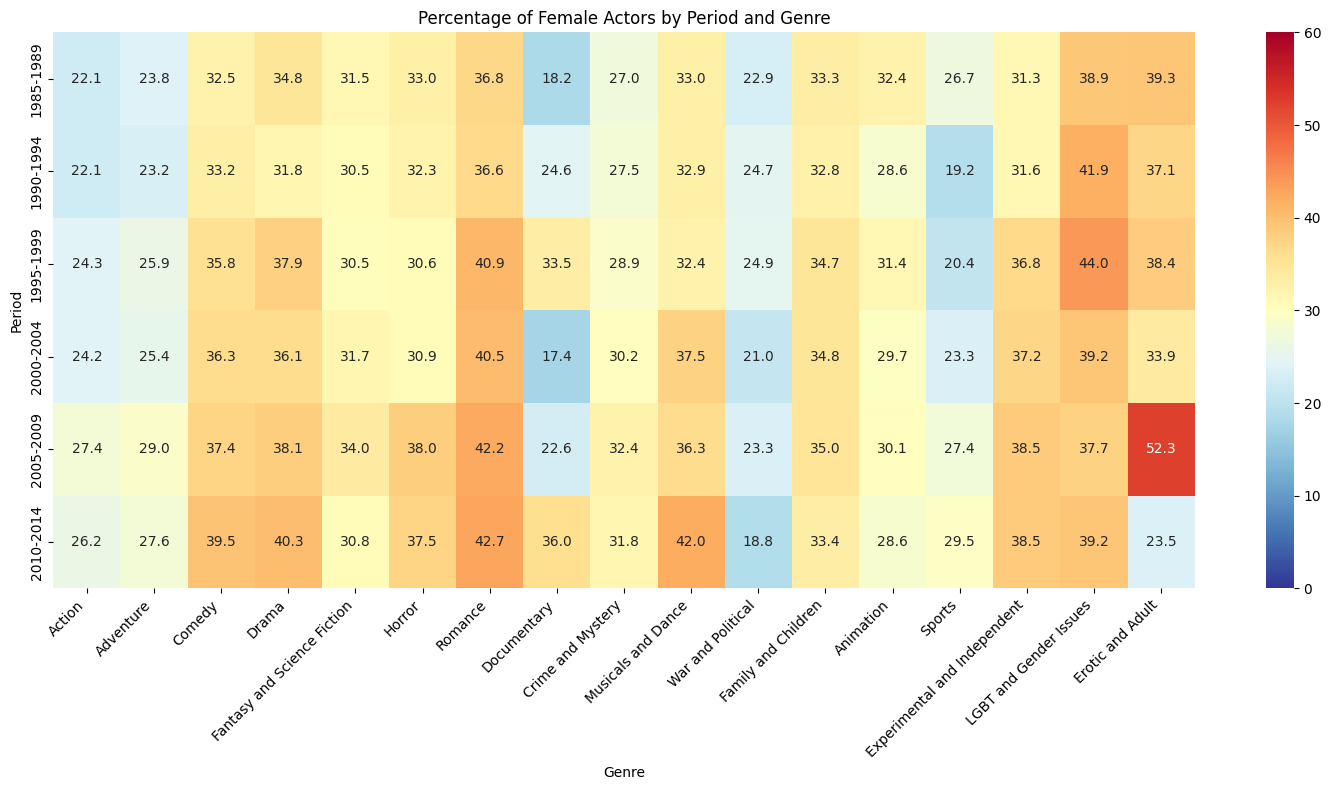
What fascinating insights into female representation across genres and time periods this HEATMAP!!!! offers.
Unsurprisingly, Romance and Erotic movies consistently show the highest percentages of female actors, peaking at 42.7% (Romance) and a striking 52.3% (Erotic and Adult) in the 2000s. These genres have historically centered women, though often within traditional or stereotypical roles.
On the other hand, even though we can notice an increase in female representation in action-heavy genres like Action and Adventure, the proportion still remains low with female representation hovering around the 22–27% range, highlighting the male-dominated nature of these categories.
Interestingly, genres such as Drama and Fantasy and Science Fiction have shown notable growth, reaching over 40% female representation in recent years, signaling progress in genres that traditionally catered to male leads. However, others, like War and Political films, remain stubbornly male-dominated despite small gains.
Overall, while progress has been made, female representation still fluctuates significantly across genres, revealing a gradual societal shift toward greater inclusivity and recognition of women in diverse roles but also underscoring the lingering influence of traditional gender norms in shaping how female characters are represented in movies.
And what about male representation ?
HEATMAP!!!!!!!!!
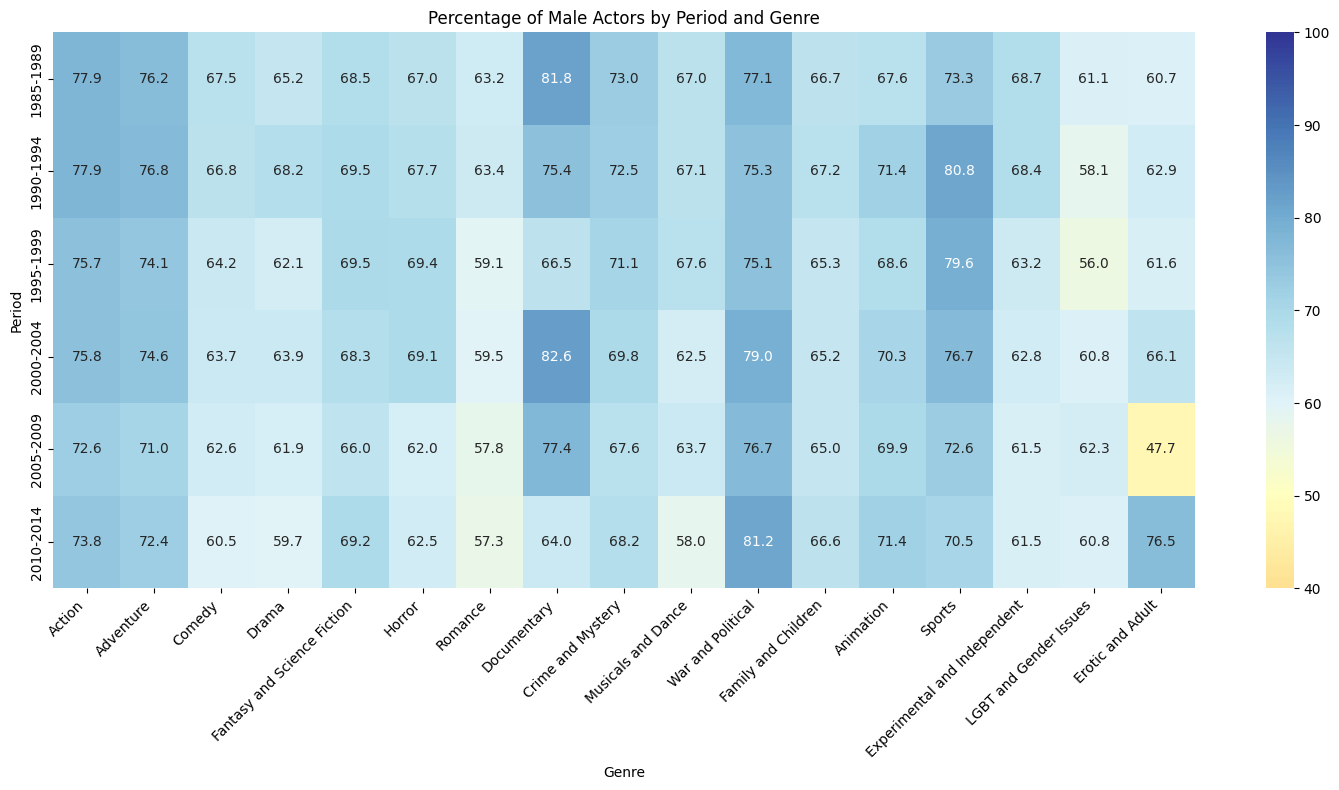
At this point, this is a surprise for no one : men have historically dominated most movie genres, and that domination persists over the decades.
Unlike female representation, which shows fluctuations depending on genre, male representation remains high and stable across many categories, with values consistently above 60–80%.
Genres like Action, War and Political, Adventure and Sports stand out as particularly male-heavy, reinforcing traditional gender roles where men are portrayed as warriors, heroes, or authority figures. On the other hand, in genres such as Science Fiction, Comedy, and Crime and Mystery, we can observe a notable decrease in male representation over time, which signals a positive shift toward greater gender balance. These genres, once heavily dominated by male leads, have begun to open up more space for female characters, reflecting a broader societal shift in how roles are defined and who gets to tell these stories.
Furthermore, there’s something interesting in genres like Romance, Musicals and Dance, and Erotic and Adult, where male representation is more and more balanced, indicating spaces where women have a larger on-screen presence, likely due to the nature of these genres centering around relationships, emotion, or intimacy.
Overall, the data reflects long-standing societal norms and expectations that have shaped cinema for decades. Men have been—and still are—at the center of storytelling, particularly in action-oriented or “serious” genres, while women have historically been confined to more emotionally-driven roles. Although all the genres show a trend towards better balance between male and female representation- which shows that society is evolving- the domination of male representation across most genres remains a stark reminder of how deeply ingrained these roles have been in both cinema and culture.
Age diversity among genders in movies
Aren’t you curious about the age distribution of actors in cinema, especially when broken down by gender? Who gets the spotlight—and at what age—for both male and female actors? Well, I am !
By exploring this, one can gain valuable insight into how men and women are depicted in movies. Are women portrayed as youthful and glamorous? Are men allowed to age into wisdom and authority? Let’s dive into the data and uncover the patterns behind the characters we see on screen.
As usual : Lady’s first…
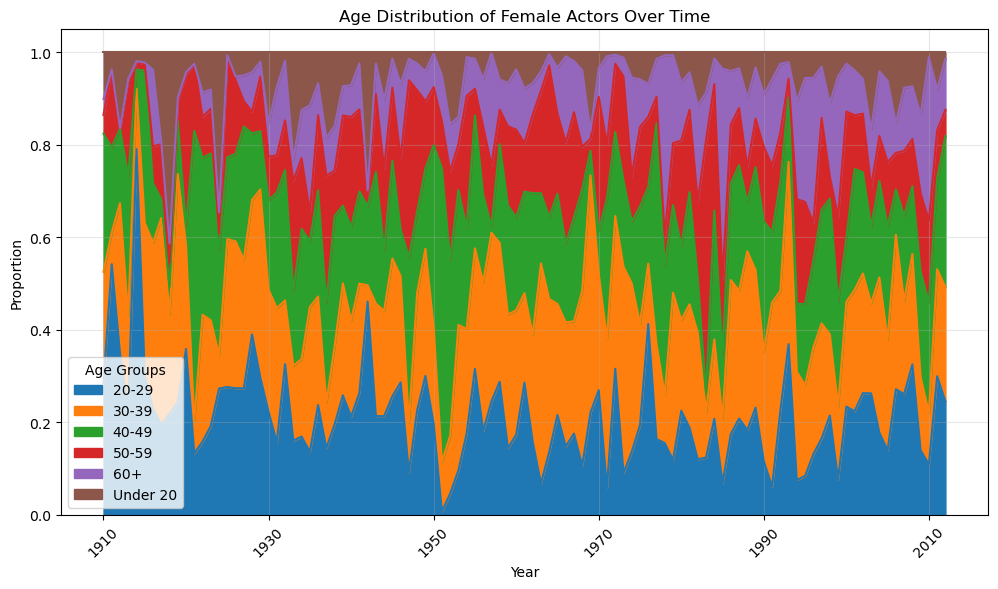
Oh, my! Just kidding, the results shown by this plot are not surprising at all. The plot tells in fact a familiar story: youth dominates the screen. Female actresses in their 20s and 30s consistently take up the biggest share of roles, while older age groups— 50+, and especially 60+—are left with scraps (probably because they are retired or something). Besides, it appears that an important number of movies tend to star actresses in their 40s from the 1930’s and onward, as the proportion of female actresses in the age group 40-49 years old consistently appears in the movie’s cast.
So what about their male counterparts?
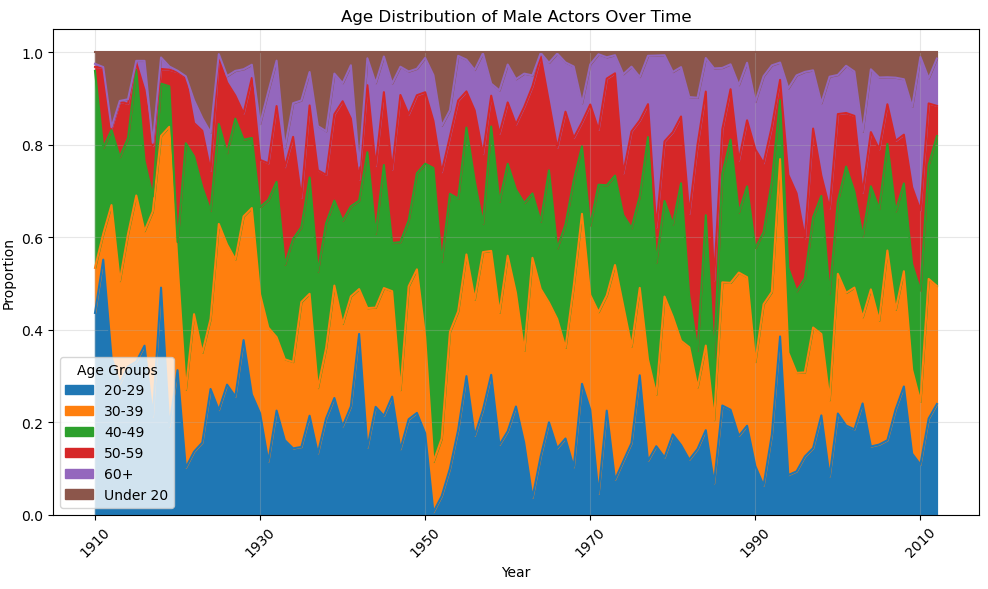
Interestingly, this trend isn’t exclusive to women; similar patterns can be observed for male actors, showing that Hollywood tends to favor younger faces for both genders. Over time, things have stayed pretty consistent: the industry loves its 20–39 age range, while opportunities for older actors steadily decline. And while the “Under 20” group makes occasional appearances, they’ve never managed to steal the spotlight (see that small brownish stain at the top of the plots).
So, it’s not just a Hollywood obsession with youthful femininity—it’s an industry-wide bias that keeps both men and women under the same ticking clock. Additionally, those observations highlight the audience’s preference to see on screen actors from similar age groups in movies, ideally actors between 20 and 50 years old.
Ah, right before I forget, your keen eye has probably already noticed that the proportion of older actors bumped up by the end of the 1920’s and remains quite steady over time . We can actually find a very rational explanation to this : yes, actors are humans too (would you believe this?), and just as any human, they too get older, thus consistently changing age groups. Since those actors are generally more experienced, they tend to still strike the eye of movie realizators for their ability to attract the public and generate higher revenue streams (This also explains the importance of the max age feature in our previous regressions!). Yet, this also means that the public is open to representation of older people in cinema, showing that society is more and more open to depiction of older male and female characters in movies.
And what about global age trends ?
Your wish is my command, dear reader. You can see here the overall age distribution of actors (age at movie release!) in the casts of our movie dataset :
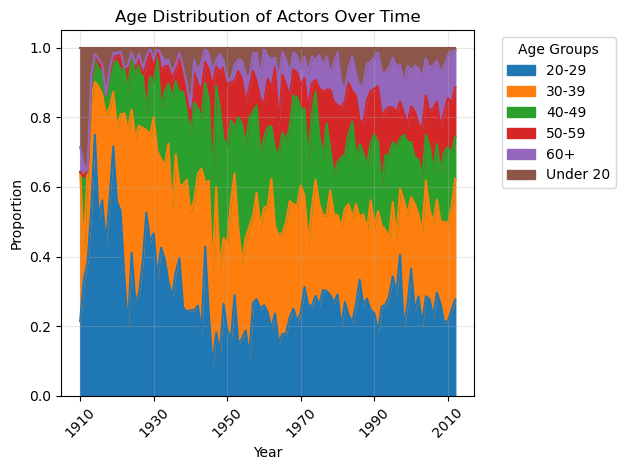
NOT unexpectedly, this confirms our earlier claims that the industry is mainly dominated by the age group from 20 to 39 years old. However, over time, we could see that the public became more prone to depiction of older characters in movies. Notice that in the early 1900s, the movie industry was largely dominated by the age group 20-29 years old, whereas the distribution was much more balanced between different age groups in 2010!
Over time, the movie industry has gradually shifted away from the stereotype of the young, feminine female character and the young, rugged male hero, embracing a wider range of character archetypes. This evolution reflects a society that has become more open-minded, increasingly accepting divergence and diversity in the portrayal of heroes on screen.
A word about the LGBTQ+ Community…
What about the depiction of the LGBTQ+ community in the movie industry? Well, as you can see, there has been a notable increase in movies with LGBTQ+ themes over time. For much of the 20th century, representation was minimal, with only a handful of movies per year featuring LGBTQ+ themes or characters.
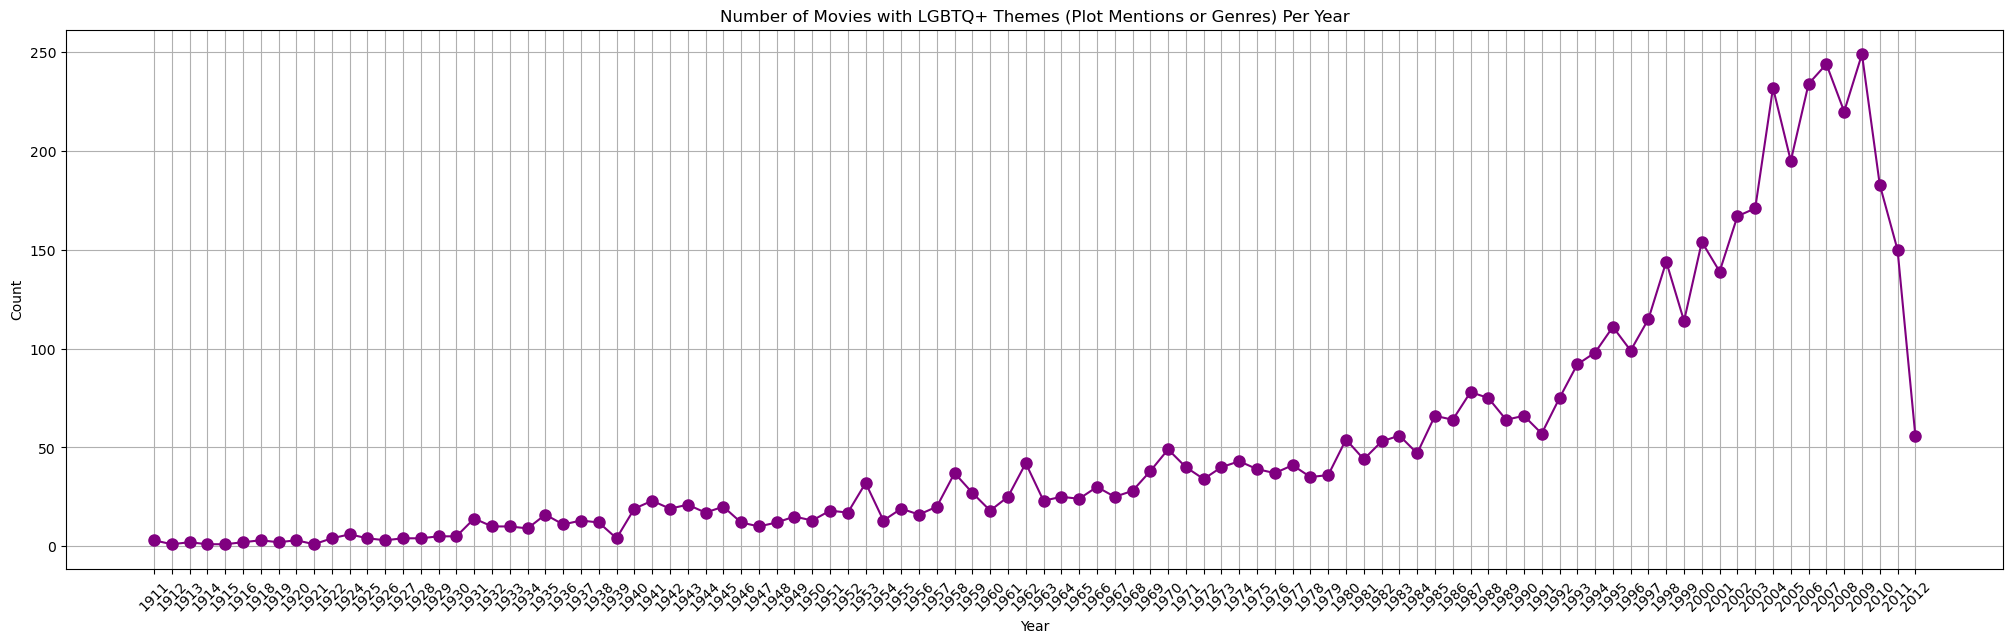
However, starting in the 1990s, there’s a clear upward trend, reflecting a growing acceptance and visibility of the LGBTQ+ community in society. This trend accelerates even further in the 2000s and 2010s, reaching its peak with over 200 movies per year (but then drastically decreasing after 2008… hmm… very suspicious).
One might think that the sharp increase highlights how filmmakers and audiences alike have become more open to stories exploring LGBTQ+ themes, breaking away from years of stigma and underrepresentation. While the sudden dip at the end may indicate incomplete data or temporary fluctuation, the overall trend is a testament to the industry’s progress toward inclusivity and diversity.
BUT WAIT…. Isn’t there an issue here? What if this increase was due to more movies being released over time ? Well you are right 😱
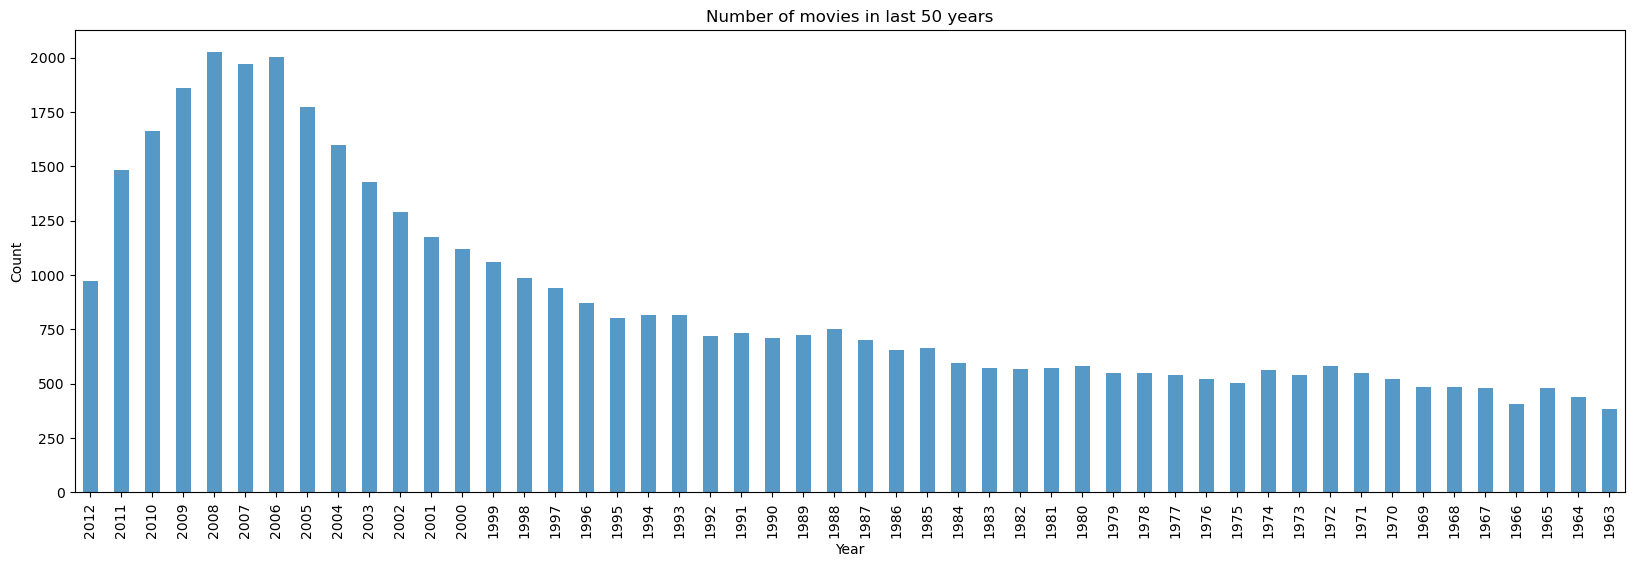
Since more movies are produced over time, we need to account for this to really understand if the LGBTQ+ community depiction in movies has increased over time. Don’t worry, we’ve got you covered! To overcome this issue, let’s analyze the mean percentage of movies covering the theme of LGBTQ+ communities instead 👍
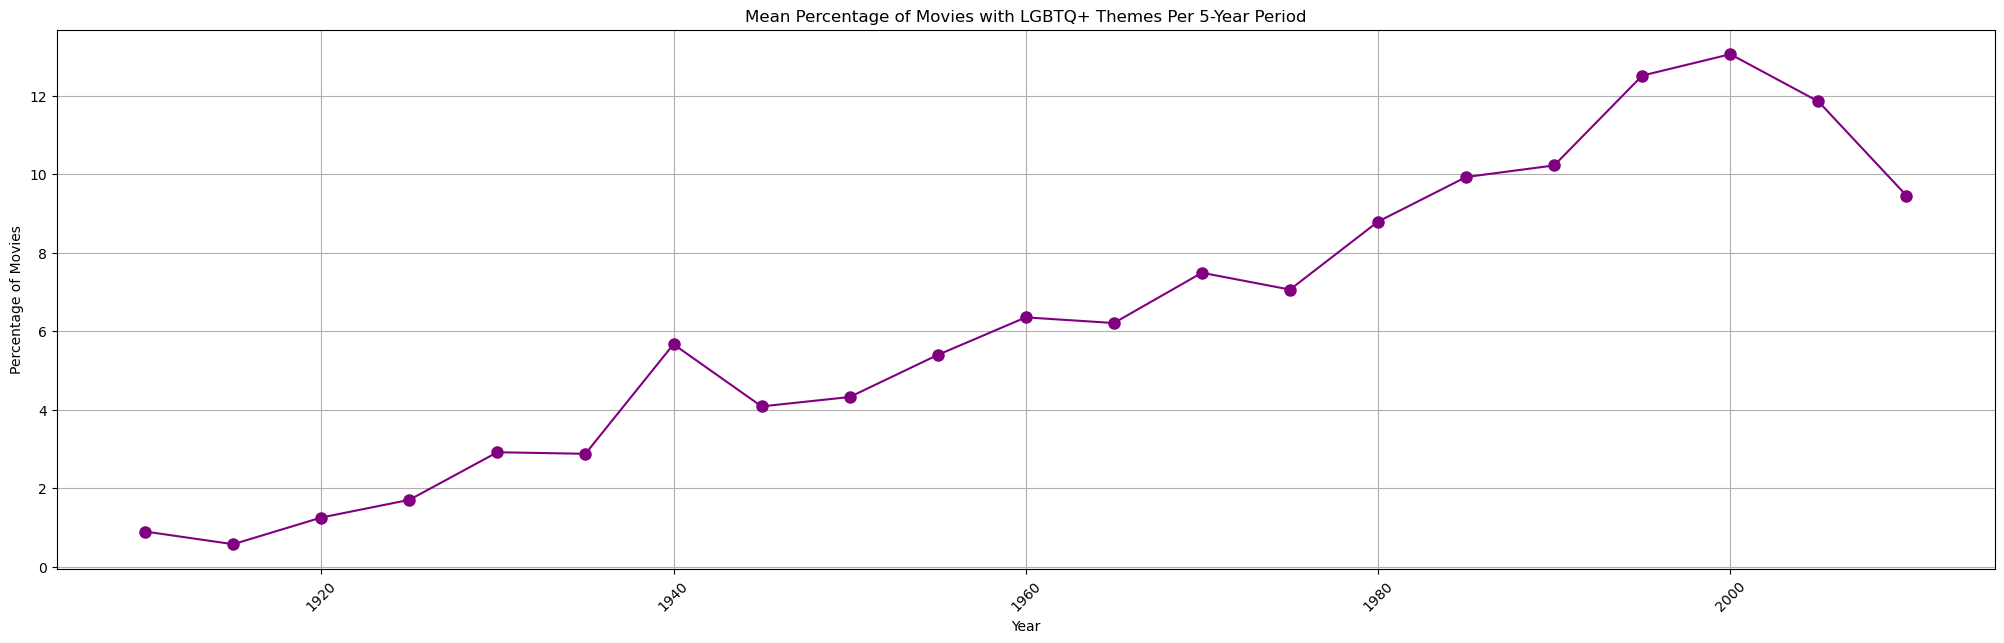
Isn’t this better? We can observe that the mean percentage of movies with LGBTQ+ themes per 5-year period has shown a steady increase over time. While the early years remained modest, with less than 1% representation before the 1920s, a notable rise began around the 1940s, followed by consistent growth throughout the second half of the century.
This trend reflects a society that has become increasingly open to diversity and inclusive storytelling, and more recognizing the rights and existence of the LGBTQ+ community.
The evolution of Ethnic representation in the movie industry across time :

Hey there, are you still following ? You better do 🧿👄🧿🔪 ! (Just kidding)
Now that we (I!) discussed the evolution of gender representation across time, let’s take a deep breath and dive towards ethnicities, our second main axis of interest.
A First Overview…
You get the scheme now : let’s start with a big-picture view, and visualize the overall ethnicity distribution in the movie industry :
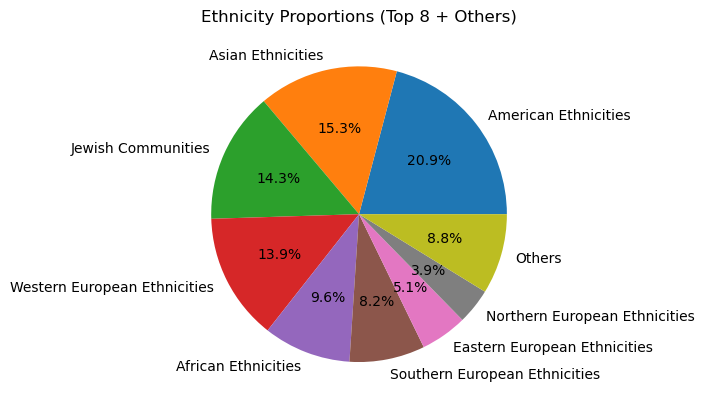
Unsurprisingly, white ethnicities (European + North American) dominate the screen (about 52% of the chart). Not so close on their heels, Asian ethnicities come in strong at 15.3%, reflecting a growing recognition of Asian talent and stories worldwide.
Next up, Jewish communities (14.3%), and further down, African ethnicities sit at 9.6%. While it’s a decent share, we can’t help but hope for more growth in representation here!
Notice that latin american ethnicities are so under-represented in movies in our dataset that it falls under the “Others” category, and same applies with Indigenous communities.
All in all, despite this colorful variety, there’s a noticeable imbalance, with a clear dominance of certain groups—particularly American and Western ethnicities—while many others remain underrepresented. So, what does this tell us? While we expect that some progress has been made in showcasing different cultures and backgrounds (from our previous regressions!), it’s clear that some groups still dominate the screen more than others. But hey, the pie is far from set in stone—let’s hope the future carves out bigger, tastier slices for everyone!
Movies average ethnic score per period
Let’s take a step forward and ask: How has ethnic representation in movies evolved over time? To answer this, we look at the average ethnic score per period, a measure that reveals how diverse– in terms of ethnicity– movie casts have been across different periods each spanning 5 years. Are we seeing steady progress toward inclusivity, or has representation remained stagnant? By breaking this down into time periods, we can uncover trends, shifts, and moments where the industry took strides—or faltered—in telling stories that reflect a broader range of ethnic backgrounds. Let’s dive in and see what the numbers have to say!
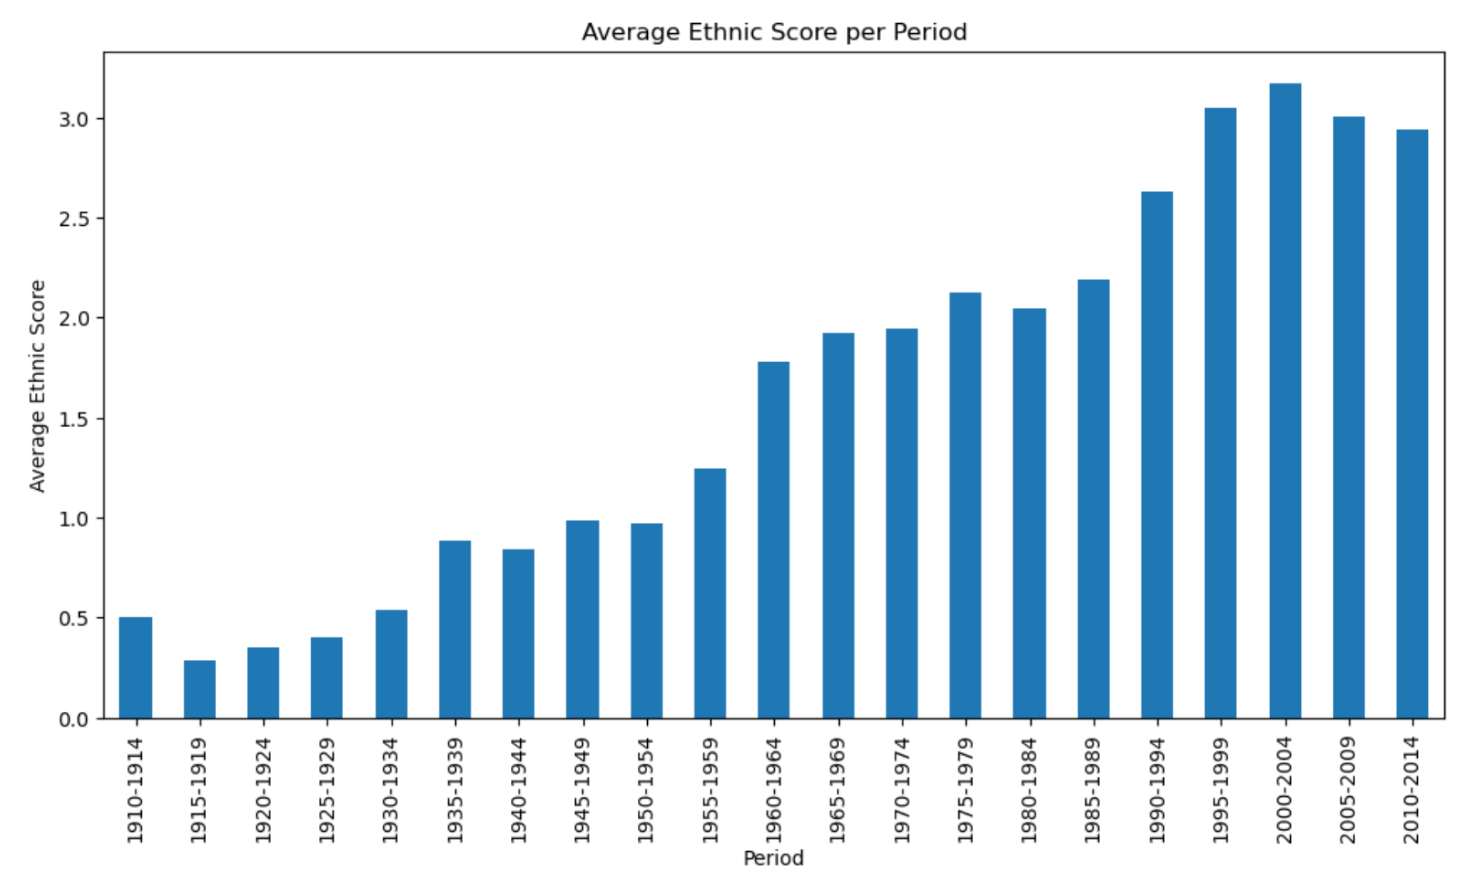
Look at this upward climb—it’s a story of progress! The average ethnic score per period has steadily increased over time, painting a hopeful picture of growing diversity in the movie industry. Starting from a modest baseline in the early 1910s, where representation was barely noticeable, we see slow but steady growth throughout the mid-20th century. By the 1960s, there’s a clear jump, reflecting a period where social change began influencing cinema.
All in all, the average ethnic score is climbing over the years, suggesting that filmmakers and audiences alike began embracing more diverse casts.
This plot doesn’t just tell a story of numbers; it’s a reflection of society’s gradual shift toward inclusivity and a greater appreciation for stories representing all cultures and backgrounds. Progress isn’t perfect, but hey, we’re moving in the right direction!
Ethnicities in movie genres : an evolution over time
Historically, certain ethnic groups have been heavily underrepresented or confined to specific genres, often reinforcing stereotypes. But how has this changed over time? Have we seen more diversity across all genres, or are certain categories still dominated by specific groups? By analyzing the evolution of ethnic representation within movie genres, we can uncover trends, progress, and lingering disparities, painting a clearer picture of how far the industry has come—and how far it still needs to go. Let’s explore what the data reveals!
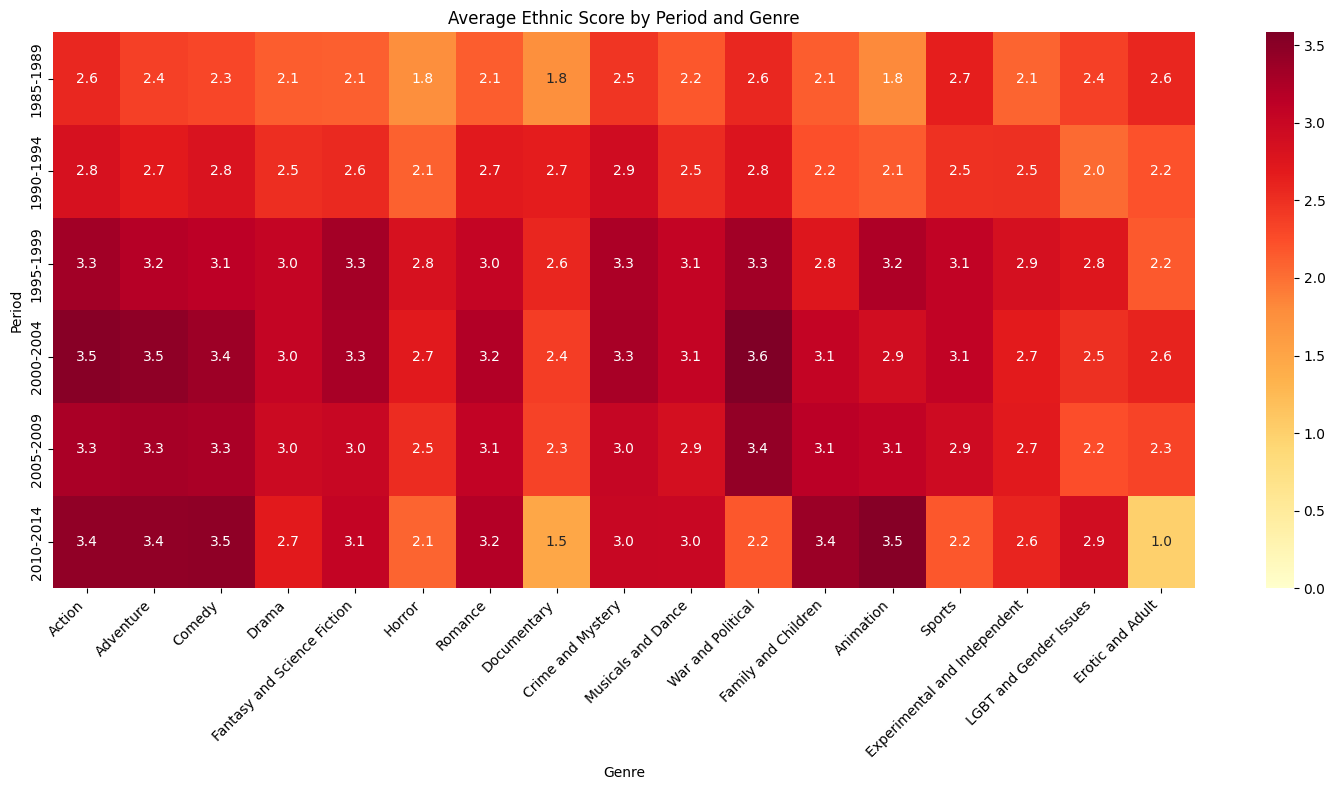
Our results show how ethnic diversity has evolved across movie genres over time—and trust me, it’s quite the journey! From the late 1980s to the 2010s, we see a steady increase in the average ethnic score, with certain genres showing real momentum. Action, Adventure, and Comedy consistently lead the way with the highest scores, suggesting that these blockbuster-driven genres were among the first to embrace more diverse casts.
Besides, there’s something particularly heartwarming about Romance. With steadily increasing scores, Romance stands out as a genre where society has become more open to seeing interracial love stories on screen—reflecting an evolving cultural mindset that embraces diversity in relationships.
But here’s the kicker: the upward trend in Animation and Fantasy reveals a growing effort to create worlds where everyone can see themselves represented. These genres, which traditionally relied on Western-centric narratives, are now embracing more inclusive and diverse storytelling, reflecting a global shift in values. It shows that society is becoming more open to celebrating different cultures, identities, and traditions, not just in grounded, realistic settings, but in imaginative worlds as well.
Overall, this heatmap paints a clear picture: while diversity has made strides across popular genres, progress is far from uniform. The data suggests a mix of progress, hesitation, and a reminder that some genres still have work to do in telling stories that reflect the richness of the world’s ethnic diversity, such as Sports and Horror movies (although this might not be the main focus of these movie genres anyway!)
Conclusion :
And that’s a wrap! This exploration of cinema’s evolution shows us that movies have always been more than just pure entertainment, they are a window into our changing world. Over the decades, we’ve seen some progress in representation, with more diverse casts and themes making their way to the big screen. But the journey isn’t complete. Despite strides toward inclusivity, there are still gaps to bridge and stereotypes to challenge.
The data reveals an industry that is slowly but surely adapting and learning. From the early days of predictable archetypes to today’s push for fresh, authentic narratives with greater diversity, cinema is growing alongside society. While the progress is encouraging, there’s still so much more to explore and achieve.
At their heart, movies are about storytelling—about helping us connect with who we are and envision who we might become. With greater representation, more people are beginning to see themselves reflected in the heroes on screen, making those stories feel deeply personal and impactful. As audiences continue to embrace these characters and narratives, the future of cinema is full of potential, driven by the limitless creativity of filmmakers and the courage to bring every story to life.