Predicting Genre From Data - A Movie Classification Project
~Discover the Hidden Secrets Behind Movie Genres~
Why Dive Into the Genre Jungle When We Could Just Watch Netflix?
~A Generic Introduction~
Movies are more than just entertainment — they are windows into stories that inspire, thrill, and move us. With over a century of cinema and thousands of movies spanning genres like drama, action, romance, horror, and sci-fi, there’s always a perfect film waiting to match your mood. But here’s the catch: how do you choose?
When scrolling through endless options on Netflix or Disney+, the genre is often our guiding light. It tells us what to expect — a nail-biting thriller, a heartwarming comedy, or a mind-bending sci-fi adventure. But how accurate are these genres? How often do they represent the true essence of the movie?
This question sparked our curiosity. What if movies could speak for themselves? What if their data — runtime, actors, themes, even emotions — could automatically reveal the genres they truly belong to?
In this project, we dive into the fascinating world of movie genres to uncover the characteristics that define them. From analyzing hidden patterns in data to testing machine learning models, we set out to answer one big question: Can we predict a movie’s genre using only its data?
Ready to see movies in a new light? Let’s begin!
Data ~In Action~
To explore what truly defines a movie genre, we needed data — and lots of it. The backbone of our analysis is two extensive datasets, each offering a unique glimpse into the world of cinema:
1. The MCU CMU Movie Summary Corpus
This dataset, sourced from movie summaries on Wikipedia as of 2012, provides detailed information for over 42,000 movies. It includes key attributes such as movie titles, release dates, genres, and plot summaries, giving us a textual and structural foundation to analyze what movies are made of. Beyond movies themselves, characters are at the heart of every story. This dataset also dives deep into the personas of movie characters, covering actor details like age, gender, and character roles. It also includes character-related data such as stereotypes, age groups, and sentiment, providing insights into how characters shape and reflect genres.
2. The TMDb Dataset
To enrich our exploration, we incorporated the publicly available dataset TMDb (The Movie Database). This dataset adds layers of information such as runtime, budgets, revenues, popularity, and votes, helping us understand how movie characteristics vary across genres.
By combining these datasets, we ended up with a rich collection of movie and character data, spanning decades of cinematic history — from the early 20th century to 2016. Altogether, this means analyzing tens of thousands of movies and characters, each contributing to the intricate puzzle of genre classification.
With this treasure trove of information, we’re ready to uncover the patterns and relationships that define movie genres. From plot lengths to actor demographics, our data helps movies speak for themselves.
Now, with the help of our datasets, we can start by looking at some general facts about movies.
Movies Through the Decades: A Cinematic Boom
As we can see, movies have become a significant part of our lives and a cornerstone of entertainment.
In the early years (before the 1920s), movie production was sparse as the film industry was still in its infancy. As technology advanced and filmmaking became more accessible, we see a steady rise in the number of films produced, particularly from the 1930s onward.
Interestingly, there are noticeable dips around the 1940s, likely due to World War II, which disrupted global film production. However, the industry rebounded post-war, continuing to grow steadily through the mid-20th century.
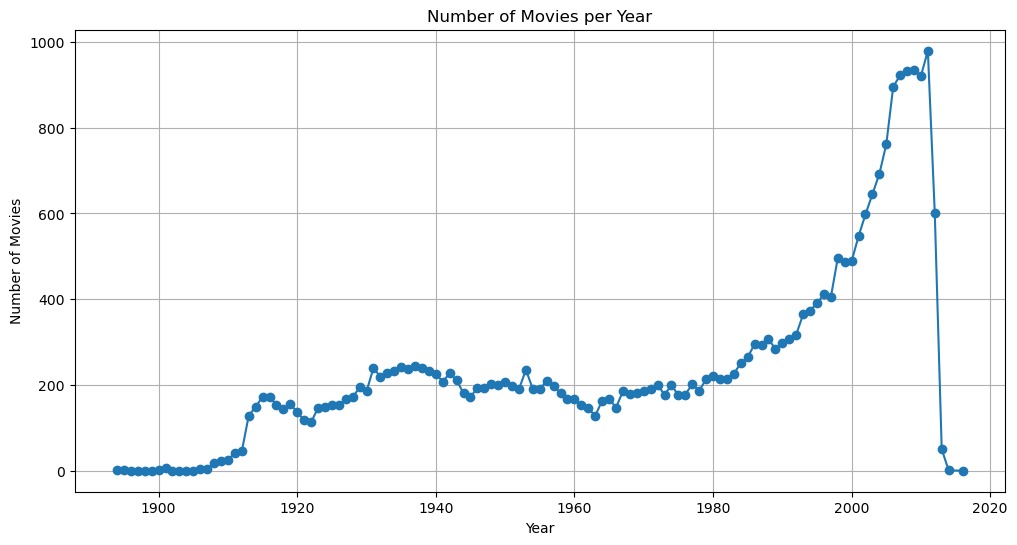
The real explosion in movie production occurs from the 1980s onwards, reaching its peak in the early 2000s. This surge can be attributed to:
- Advances in technology and filmmaking techniques.
- The rise of global film markets and independent cinema.
- The accessibility of digital filmmaking, which drastically lowered production costs.
Now, let’s dive into the box office battle, where we explore how the data behaves across genres to give us a clear overview of the fascinating relationships between budgets, revenues, and ratings.
Box Office Battles: Ratings, Revenues, and the Rise of the Blockbuster
This following graph is like peeking behind the curtain of the movie industry, where romance (blue) and horror (red) duke it out on the battlefield of budgets, revenues, and ratings. Nestled in our "overview of the data" section, this visual spectacle showcases how these genres have entirely different strategies for stealing the audience's hearts—or scaring the popcorn out of their hands.
Romance and horror couldn't be more different when it comes to budgets, revenues, and how ratings influence their success. Romance tends to go big, with massive budgets occasionally leading to blockbuster revenues (cue the giant blue circles). Horror, however, plays it smart, thriving on smaller budgets and consistently turning a profit—even with lower ratings. While romance needs big bucks and critical acclaim to shine, horror proves you don’t need a big budget to make big screams (and cash).
The size of the circles tells us how audience ratings impact revenues. Romance films with higher ratings (those big, bold blue circles) tend to dominate the revenue charts, showing that critical and audience appreciation is key to their success. In contrast, horror movies are more forgiving of lower ratings. Even small red circles appear in the higher revenue zones, proving that horror fans are loyal and willing to turn up for a good scare, even if the critics don’t approve.
The graph makes one thing clear: genre is everything. It shapes not just the type of stories told, but also how they’re made, marketed, and received. Whether you’re swooning over love stories or screaming through horror flicks, genre isn’t just a label—it’s a whole strategy. Without it, the movie industry would be… well, a scary mess.
The Statistics of Storytelling ~Science or Fiction?~
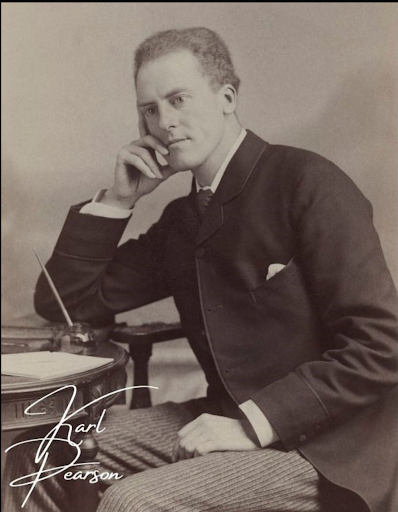
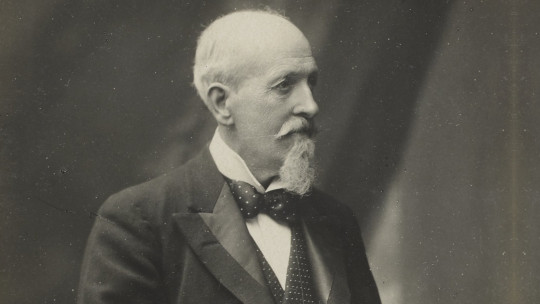
Like it or not, statistics very much fall into the non-fiction category, so let's take a brief look at this short documentary that will introduce us to two important characters of our journey.
Pearson Correlation: Linear Relationships
The Pearson correlation measures the strength and direction of the linear relationship between two variables. It answers the question: When one variable increases (or decreases), does the other do the same, and in a predictable way?
- Scale: The Pearson correlation coefficient ranges from -1 to 1.
- 1: Perfect positive linear relationship (as one goes up, the other does too)
- 0: No linear relationship.
- -1: Perfect negative linear relationship (as one goes up, the other goes down).
- When to Use It: When your data is normally distributed and you expect the relationship between variables to be linear.
Spearman Correlation: Ranks and Non-Linear Relationships
The Spearman correlation, on the other hand, is all about ranks. It measures how well the relationship between two variables can be described by a monotonic function (i.e., consistently increasing or decreasing, but not necessarily in a straight line).
- Scale: Like Pearson, Spearman ranges from -1 to 1.
- 1: Perfectly monotonic increasing relationship (as one variable’s rank increases, so does the other’s).
- 0: No monotonic relationship.
- -1: Perfectly monotonic decreasing relationship.
- When to Use It: When your data is not linear or when you’re dealing with ordinal data (e.g., ranks or categories).
What Makes a Genre? ~The Mystery to Investigate~
Genres are the backbone of cinema. They are the categories that shape our expectations and guide us to the stories we love. Whether it’s the thrill of an action-packed chase, the tears of a heartfelt drama, or the laughs of a lighthearted comedy, genres provide the lens through which we view and connect with movies.
A Slice of the Genre Pie 🍰
To start off, this delightful pie chart gives us a bird’s-eye view of the distribution of movies across genres. Here’s what stands out:
- Drama takes center stage with the largest slice of the pie at 17.7%. No surprise here — drama has always been a storytelling staple, reflecting the depth and complexity of human experiences.
- Comedy (11.4%) follows, reminding us that everyone loves a good laugh.
- Action/Adventure (7.15%) and Romance (6.25%) keep us entertained and swooning, proving that audiences love excitement and love stories alike.
- The smaller slices, like World Cinema and Short Films, highlight niche categories that cater to specialized tastes and artistic expressions.
Connections Across the Movie-Verse
If genres are the personality traits of movies, this graph is like watching them interact at a party—and oh boy, some genres are really good friends! This vibrant chord diagram gives us a visual map of how genres relate to one another, revealing the bridges that connect them. The thicker the bridge, the stronger the connection between two genres.
What can we see? Genres like Action and Adventure are practically inseparable, with their strong connection reflecting their shared characteristics of excitement, fast-paced storytelling, and adrenaline-filled plots. Similarly, Drama is like the social butterfly of genres, bridging gaps with Romance, Thriller, and even Crime. It makes sense—drama is everywhere, whether it’s a tragic love story, a suspenseful heist, or a courtroom showdown.
Surprising friendships pop up too. Who would’ve guessed that Music/Dance shares a notable bond with genres like Romance? Turns out, nothing says love like a duet or a waltz under the moonlight. And then there’s Horror, often connecting with Thriller and Mystery—a trio of spine-tingling tales that play on our deepest fears.
Why does this matter? This graph helps us understand the fabric of storytelling. It highlights how genres aren’t isolated silos—they’re interconnected, borrowing and blending elements from one another. These connections not only make genre classification more complex but also show why some movies resonate with broader audiences.
Romance vs. Horror: A Love-Hate Relationship (with Numbers)
When you pit romance against horror, what do you get? A mathematical tug-of-war between love and fear, captured perfectly in these heatmaps. But here’s the twist: the correlations you see here aren’t standalone—they’re romance minus horror. That’s right, it’s a love story where the data takes the spotlight.
The bright yellow spots reveal where romance dominates: longer plots and a preference for actors aged 20-40. Clearly, romance movies take their sweet time setting up the perfect meet-cute, while horror is more about “Who’s going to die next?” in as few words as possible.
But horror doesn’t go down without a fight. Darker patches in the heatmap show where horror’s spooky vibes pull ahead—higher correlations with shorter plots, character counts, and actors in younger or older age ranges. It seems horror doesn’t discriminate; anyone from teens to seasoned veterans can fall victim to its chilling narratives.
One fascinating takeaway? Revenue and vote averages show lower correlations for romance than horror. Apparently, horror knows how to cash in on its scares, while romance, despite its heartfelt tales, isn’t always about the box-office glory. And, for all its drama, romance might be losing ground in the high-stakes popularity game.
In the end, this heatmap reminds us that genres don’t just tell stories—they tell us about the people they target and the emotions they evoke. Romance and horror may be polar opposites, but their data-driven rivalry is a match made in statistical heaven… or maybe statistical hell, depending on your perspective!
How Actors Define Genre ~A Look Behind The Scenes~
What’s a movie without its actors? They’re the faces we laugh with, cry over, and sometimes yell at for making bad decisions (we’re looking at you, horror movies). But have you ever wondered if the type of actors in a movie — their age, their experience — tells us something about its genre? Maybe action movies lean toward younger, energetic stars, while dramas prefer seasoned veterans with emotional depth. Well, wonder no more! Let’s take a closer look at the fascinating relationship between who’s in a movie and what kind of movie it is.
Stacked Bars of Genre Glory
The stacked bar chart takes the exploration to the next level. Here, you can compare how different genres allocate their casting across age groups. And yes, it updates dynamically based on your selections!
- If you select action and thrillers, you’ll see a strong focus on actors aged 20-40, the age group of choice for adrenaline-fueled roles.
- Choose comedies and family films, and you’ll notice the 0-20 group taking a bigger chunk — these genres thrive on youthful energy and humor.
- Interested in biographical dramas? The graph will highlight a larger share of 40-60+ actors, reflecting the life stories these genres often depict.
The stacked bar chart takes the exploration to the next level. Here,
By comparing genres side by side, you can see how the casting shifts between them. It’s a fun way to explore how each genre tailors its actors to fit its narrative style.
Sure, genres dictate the ages of actors—because apparently, you can’t
have a family film without a squad of pre-teens or a historical drama without someone
looking wise and weathered. But age isn’t the only casting curveball genres throw. The gender
balance in movies can be just as telling! Whether it’s action films that scream, “Bring me all the
tough guys!” or romantic comedies assembling equal
parts swoon-worthy men and quirky women, the genre has a lot to say about who gets the spotlight.
Do you see this plot? No? It's up to you to click the buttons and play around to see the plots!
It seems like male actors are throwing a party and forgot to send the invites to their female counterparts. In action-packed genres like War/Combat, Political, and Action/Adventure, men are dominating the stage like it’s a testosterone-fueled festival. Meanwhile, women in genres like Horror, Holiday Films, and Romance seem to be stuck playing “Where’s Waldo,” with their numbers as tiny as the budget for a low-budget indie flick. However, there are glimmers of hope—genres like Friendships, Family & Personal Relationships and Indie seem to be more gender-inclusive, proving that sometimes, all it takes is a good script (or maybe just better casting directors). So while the industry may still have a ways to go, at least in certain genres, the plot is thickening in favor of diversity.
What Stories Tell Us About Genres ~The Plots and Twists~
Movies are more than just visuals; their plots shape how we experience them and, ultimately, the genres they belong to. The words used in movie summaries give us a sneak peek into their core themes. Whether it’s a suspenseful “escape” in a thriller or a heartfelt “love” in a romantic classic, the vocabulary of a movie often hints at the genre. So, we decided to dive in and explore: what do movie plots reveal about genres?
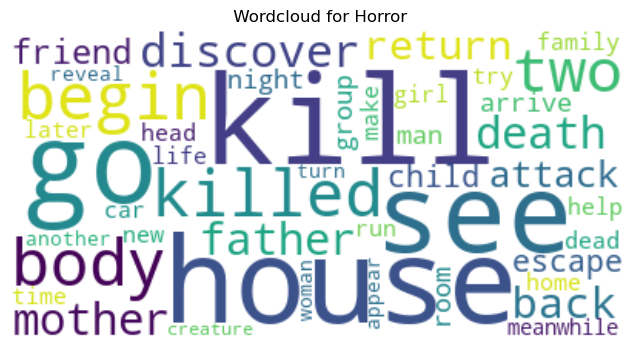
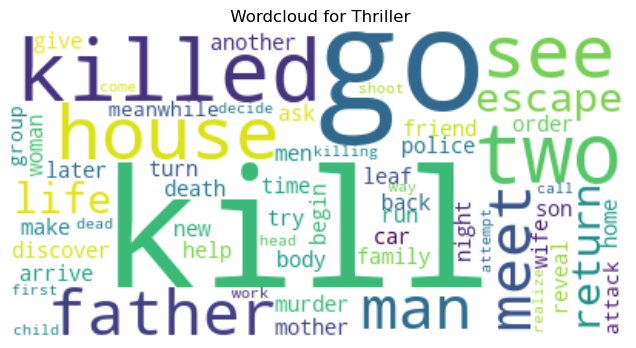
To start, we took a closer look by visualizing the most frequently used words in the plots of different genres.
Close Neighbors: Horror vs. Thriller
Let’s start with genres that are close cousins — horror and thriller. The word clouds show a lot of overlap in terms like “killed”, “house”, and “father”. It seems both genres love a good family-related scare or a mystery involving death.
The difference? Horror leans into more unsettling words like “creature” or “attack,” while thrillers focus more on action-oriented words like “escape” and “discover.” It’s the difference between outright terrifying you and keeping you on the edge of your seat.
Worlds Apart: Action/Adventure vs. Old-Fashioned/Classical Style
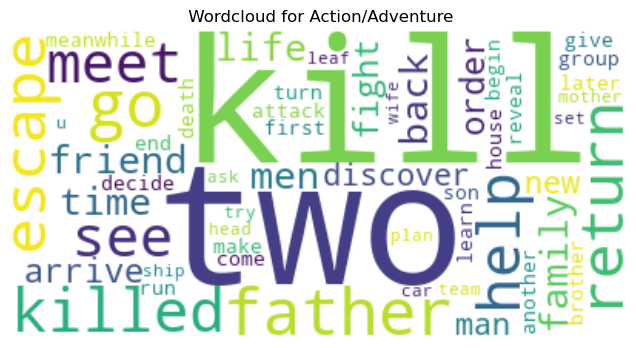
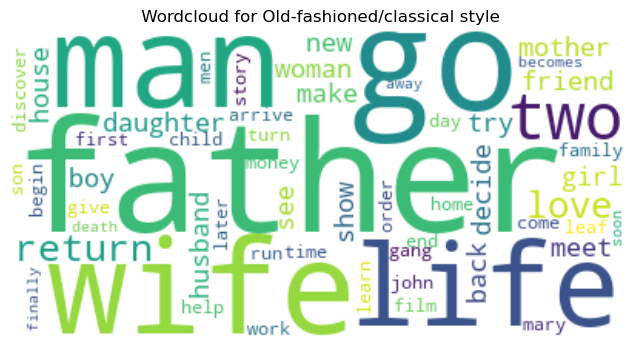
Now, let’s compare genres that couldn’t be more different. Action/Adventure and Old-Fashioned/Classical Style might as well come from different universes.
- Action/Adventure thrives on movement and danger — words like “escape”, “killed”, and “fight” dominate the cloud. These movies scream adrenaline and urgency.
- Meanwhile, Old-Fashioned/Classical Style slows things down with words like “man”, “wife”, and “life”. It’s all about relationships, reflection, and a touch of nostalgia.
This contrast shows how genres cater to completely different storytelling styles and emotional experiences.
Digging Deeper: Searching for Specific Themes
We didn’t stop there. We went hunting for specific themes across genres using keywords from movie summaries. For example:
- The following pie chart reveals how frequently specific terms (like "love" or "death") show up across different genres.
- Unsurprisingly, some words are heavily skewed toward certain genres, with “love” dominating romance and “death” creeping its way into horror and drama.
This type of analysis shows us how genres are built on recurring themes and language, offering a deeper understanding of what audiences expect from each.
Mood Swing Cinema: Which Genres Make You Cry, Cheer, or Scream?
This graph dives into the emotional tones of movie plots, measuring whether they lean positive, negative, or somewhere in between. Here are some key takeaways from the sentiment analysis across genres:
- Heartwarming or Tragic?
- Genres like Romance, Family/Children’s movies, and Music/Dance tend to skew more positive. Their stories are often uplifting, heartwarming, and filled with themes of love, joy, and resolution.
- On the flip side, Horror clearly leans heavily into negativity, with the lowest sentiment scores of all genres — fitting, since fear, death, and suspense rarely make for feel-good vibes.
- A Balanced Approach
- Genres such as Drama, Mystery/Suspense, and Thriller strike a balance between positive and negative tones. These genres explore a range of emotions, from joy and hope to conflict and despair, making them feel more nuanced.
- Unexpected Surprises
- Interestingly, Holiday Films show some surprising spikes in negativity. Could this hint at the emotional conflict or family drama often embedded in these otherwise festive stories?
- Action/Adventure maintains a positive edge, suggesting that while the stakes are high, the triumph of good over evil tends to leave audiences feeling satisfied.
- Cultural Nuances
- The graph also reveals how genres like Asian Movies or Religious Films bring unique tones, influenced by storytelling traditions and cultural themes that differ from Western cinema.
Cinema’s Emotional Rollercoaster: Themes Meet Feels
Movies aren’t just about explosions or dramatic gazes—they’re emotional powerhouses fueled by themes. From the warm fuzzies of love to the soul-crushing doom of tragedy, this Pearson correlation chart spills the tea on how themes dictate our emotional highs and lows. Let’s break it down!
No shocker here—happiness is riding high on the positivity train, while death and tragedy are dragging us into the emotional abyss. Love keeps it balanced, sprinkling joy with a dash of drama, because life’s complicated, right? Meanwhile, fear and revenge lurk in the shadows, perfect companions for horror and thrillers. Themes like family and hope try their best to keep things wholesome, while justice and survival walk the fine line between triumph and despair. It’s a plot twist of emotions—just the way we like it!
Comparing Spearman and Pearson is like watching two critics agree on the big stuff but bicker over the details. Both call happiness the MVP of good vibes and death the ultimate buzzkill, so no surprises there. Spearman, the rank-obsessed cousin, focuses on consistent mood trends—like how fear reliably tanks sentiment. Meanwhile, Pearson, the linear thinker, cares about exact proportional relationships, making themes like justice and family seem less impactful. Bottom line: they both agree on the plot twist (death = bad vibes), but their perspectives make them a dynamic duo for dissecting cinema’s emotional themes!
While Spearman and Pearson bickered over correlations and sentimental nuances, it’s time to shift gears and dive into something a bit more predictive. If themes and sentiments reveal the soul of a story, can we use that knowledge to peek into the future? Enter the movie genre predictor model, where algorithms swap their popcorn for data-crunching to determine if they can guess a movie's genre based on its plot. Let’s see if machines can steal the show!
Movie Genre Predictor Model ~Adventures in Machine Learning~
Why did we create a model? Well, because sometimes movie genres feel like they were chosen during a particularly confusing game of darts. "Is it a comedy? A drama? Both? Neither?" Genres can often be vague, misleading, or downright baffling. So, we decided to do better. Enter our movie genre predictor model, where data speaks louder than human guesswork.
Why so many models? Since we do not chill with our objective, we are not going to use just a model. Why? Because we don’t know which one will work best (we’re not mind readers, sadly). Different models are good at different tasks, so we threw six contenders into the ring: four classic algorithms and two neural networks. Think of it as our own little algorithm Hunger Games.
The Competitors:
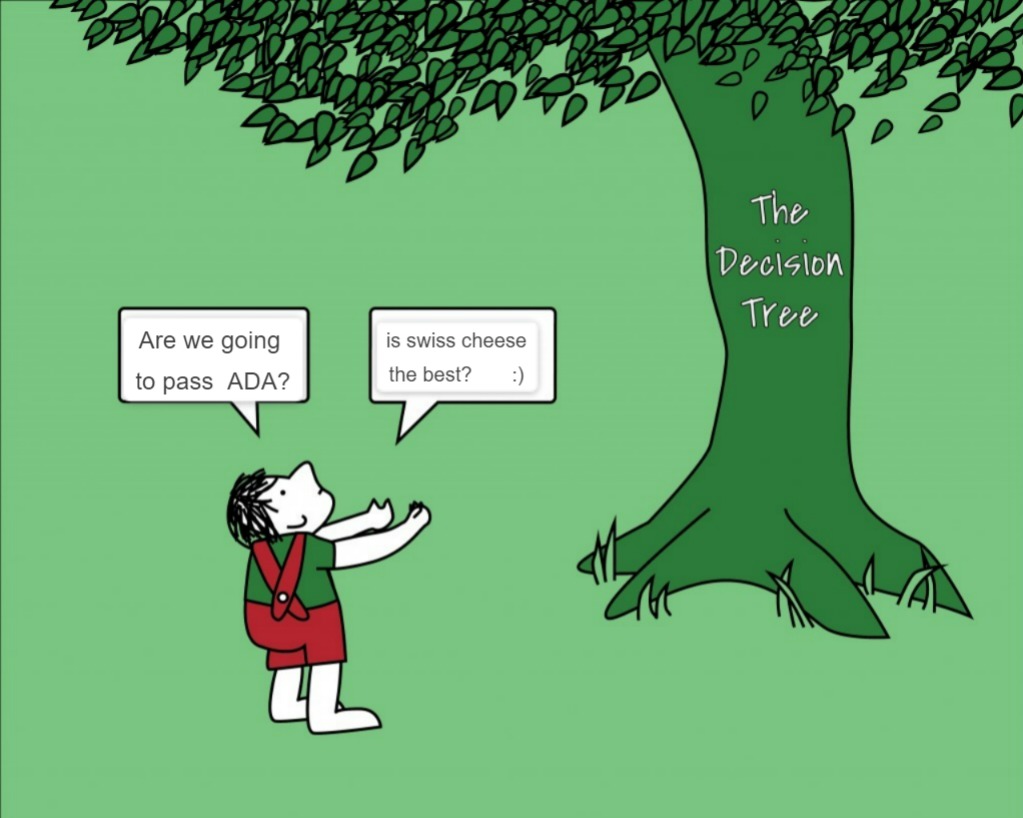
Decision Trees: Sherlock Holmes in Data Form
Imagine a flowchart where every question is a decision point. A decision tree looks at your movie data — say, runtime, budget, or number of actors — and splits it into "branches" based on yes/no questions.
- Example: Is the runtime over 120 minutes? Yes? Then maybe it’s an epic or historical drama. No? Maybe it’s a comedy or horror.
At the "leaves" of the tree (the end points), the algorithm decides whether your movie belongs to a specific genre or not one at a time: We are going to have one tree per genre, each ruled by different split decisions. Decision trees are straightforward, intuitive, and great for explaining why a movie is classified the way it is — like Sherlock Holmes explaining his deductions.
Random Forest: A Party of Trees
A single tree is good, but sometimes it can overthink or overfit and look, being a lonly tree is sad, isn’t it?. Random forests solve this by creating lots of decision trees, each trained on slightly different subsets of the data using techniques like bootstrap. For every genre we have a forest: Every tree votes, and the majority vote decides the fate of the movies (belongs or not belongs to that genre…).
- Why is this cool? If one tree says "yes" and the others say "no," the forest can overrule the rogue tree.
- Think of it as a jury trial for your movie: each tree is a juror, and together they make the final decision.
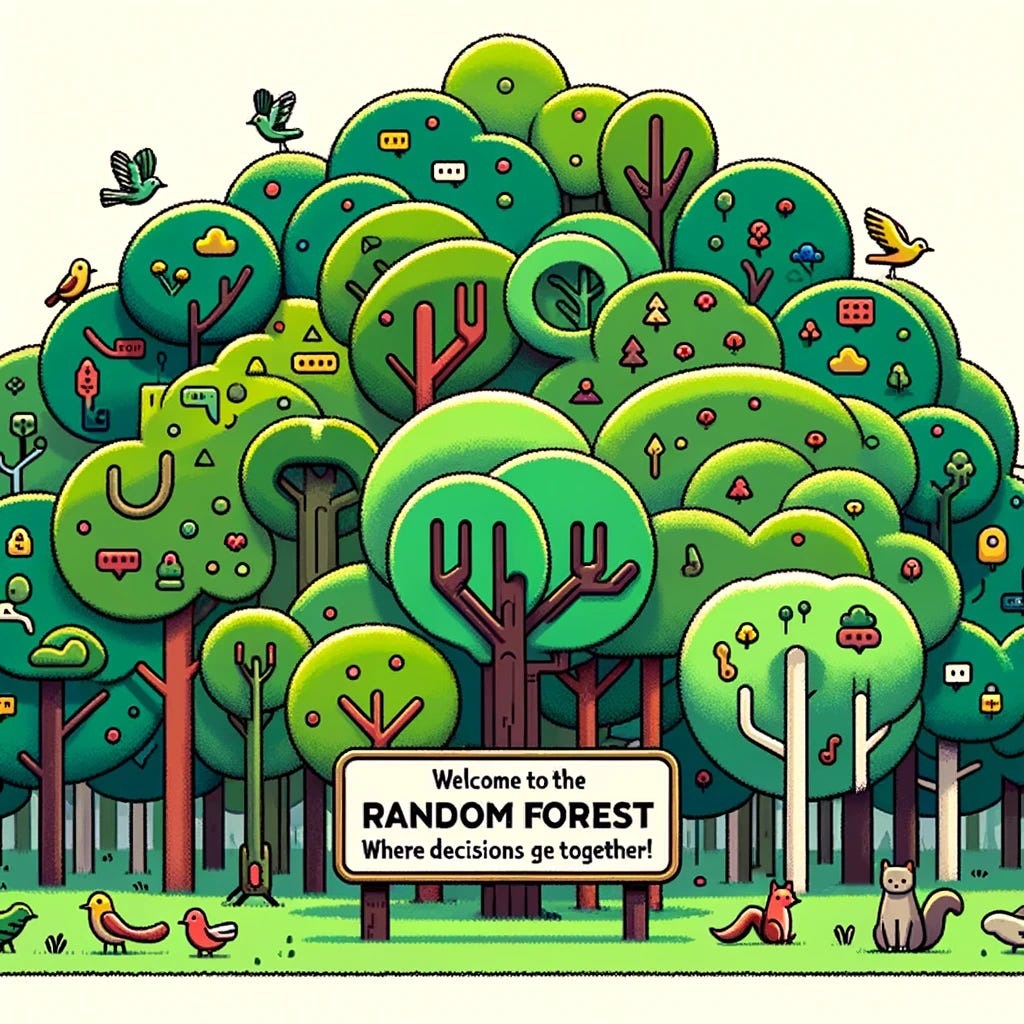
Random forests add robustness and reduce the risk of a single bad tree messing everything up.
K-Nearest Neighbors (KNN): The Neighborhood Watch
This model doesn’t assume much about the data. Instead, it lets the data speak for itself by comparing your movie to its "neighbors."
Here's how it works:
- Imagine all the movies as points in a multi-dimensional hyperspace (where each feature like runtime or budget is a dimension).
- Your movie lands somewhere in this hyperspace, and KNN looks for the "k" closest movies — its neighbors.
- It checks what genres those neighbors belong to and assigns your movie the genre that’s most common among them.
- For each genre, it looks how many of those neighbours belong to it, then if more than half of them do, it decides that our new movie also does belong to that genre.
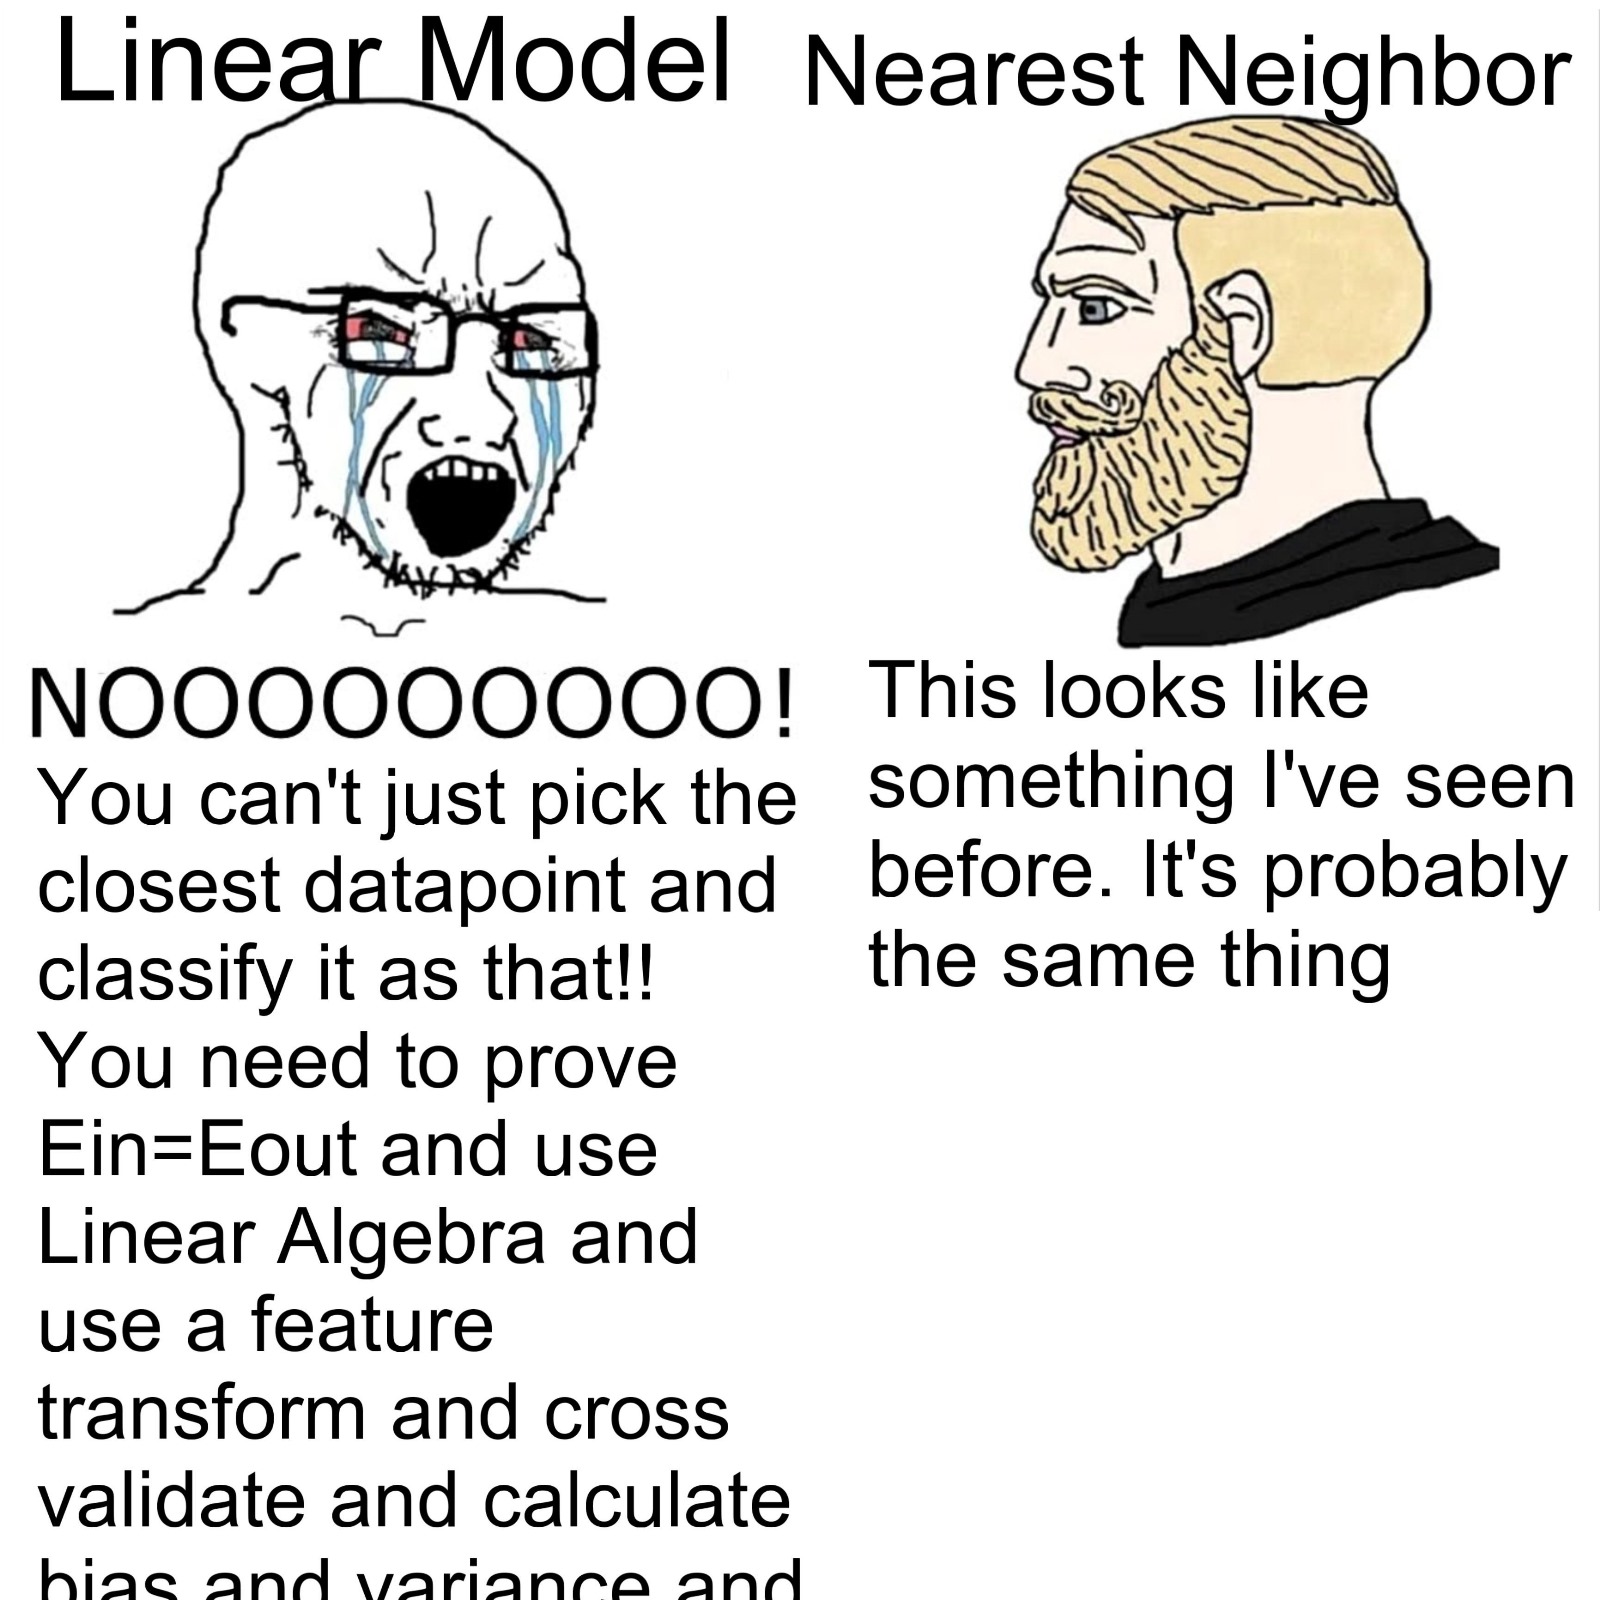
This method is simple but effective. For example, if your movie is surrounded by romantic comedies, chances are it’s one too. It’s like asking your closest friends, "What genre does this movie feel like to you?"
Regression: Drawing the Lines
Regression isn’t just for numbers — it’s great for classification too. Here’s the idea:
- Imagine you’re plotting movies on a graph with two axes (say, budget and runtime). Regression draws a line to separate the genres.Example: If the line is "below 2 times minutes and 0.5 times budget”, it’s a comedy; above that, it’s not.
- If we have more dimensions (more features), instead of a line we have a hyperplane that divides the hyperspace.
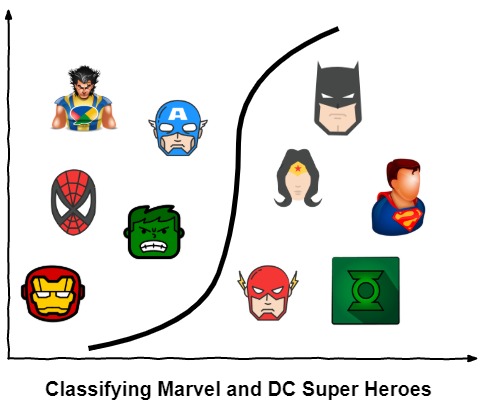
The regression model finds the best hyperplane for each genre. Then uses that as a rule to divide the hyperspace for each genre into two parts. One by one, if moves are on one side of a hyperplane or on the other, they belong or not to a genre.
We use a regularized version of the standard regression, the Ridge Regression. It avoids overfitting, making it a super-efficient classifier. It’s straightforward, though not as flashy as neural networks.
Neural Networks: The Data Brainiac
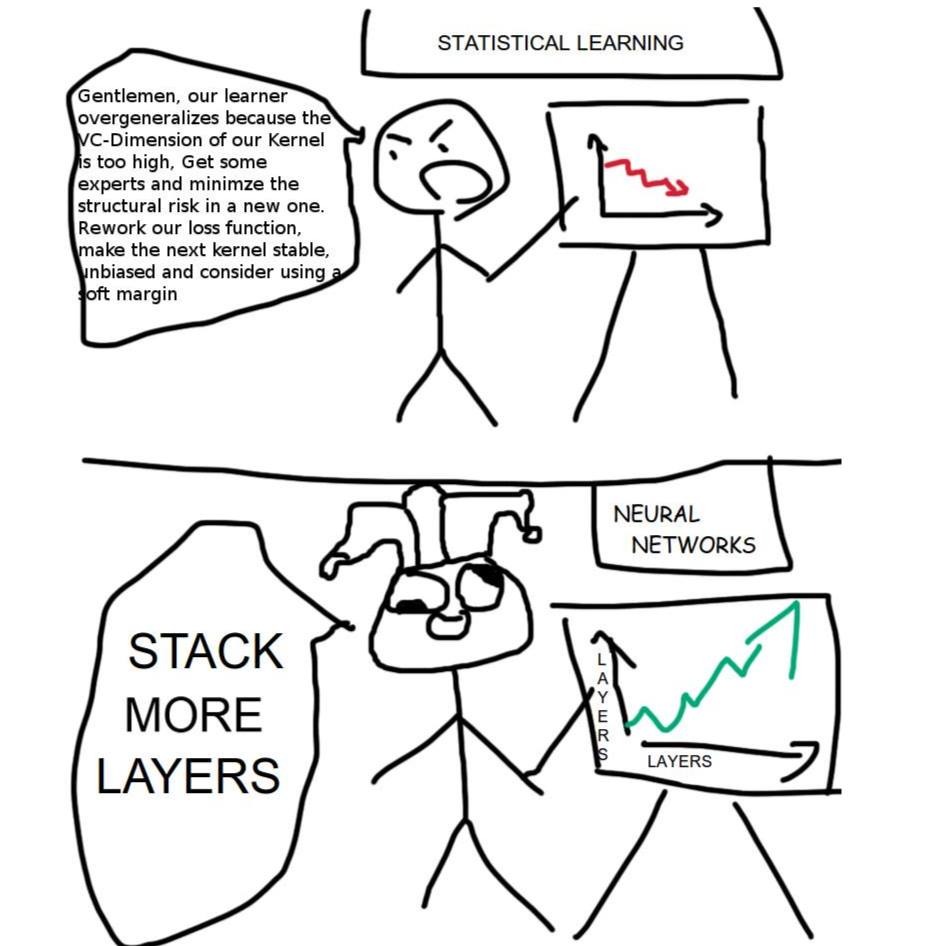
Neural networks are the overachievers of machine learning. Inspired by how our brains work, they process data through layers of "neurons." Each neuron takes in inputs (features like runtime, budget, or actor count), applies weights and biases, and passes the result to the next layer.
- Input Layer: This is where all your movie data comes in.
- Hidden Layers: These are the magic zones where the network learns complex patterns. The more layers, the more abstract patterns it can detect.
- Output Layer: This gives probabilities of the movie to be for each genre. For example, "60% sure is comedy, 30% sure is drama, 10% sure is action..."
Why is this powerful? Neural networks can find relationships in the data that simpler models might miss. For instance, they might learn that movies with "high budgets + long runtimes + low vote counts" are often historical dramas or something even more complex!.
However, they are not that easy to train, neither to interpret — so we think of them like a black box of genius. We are going to use two kind of Neural Networks. One on a box-like shape and one with a U-like shape.
The fist one has more neurons and so is able to get more complex relations between the features. Meanwhile, the U-shape one “compresses” the data in fewer neurons so the information can be mixed. Then, both rescale the layers into the right size to make the predicition.
Why Use These Models Together?
Each model has its strengths:
- Decision trees are easy to interpret and explain.
- Random forests are robust and accurate.
- KNN is simple and doesn’t assume much about the data.
- Regression is efficient and works well for simpler patterns.
- Neural networks are powerful and capture complex relationships.
By trying multiple models, we get a better sense of what works best for predicting genres. Plus, it’s fun to watch them compete!
How Do We Compare Their Performance?
The F1 Score is our referee. It balances precision (how many predictions are correct) and recall (how many relevant genres are identified). A high F1 score means the model is both accurate and comprehensive — perfect for genre classification.
Fine tuning the models
Default settings may be good, but sometimes we need to look closer to see which ones make our models work better.
The first thing we do is grid search of all the possible features of the models. One by one we try which option is better with the other settings fixed. At the end we choose the best combinations.
Also, we do a feature selection process where, sadly, we discard some before training the models. Why? Well, even if our big boy look big, they may get overwhelmed by all the data, overfit, or not focus on the important parts. We remove some data that may not be that useful and in the process we make our models fasters (less computations, less time thinking).
At the end, we removed features like 'tragedy', 'betrayal', or 'fear’ from the plot topics. Why? As we saw before some of those share words that may be just useless for the classification. Also 'N/A actor count' is a feature that comes from the lack of information in the dataset. Like those, we end up finding more. It is sad but we have to say bye to them in order to achieve our goal. :,(
Training the beast
Training a standard model is rather simple: Get the data, get the model, feed the model the data :). Yet, not all is happiness, neural networks require more work. Usually we will have
to feed them the data more than ones (have some epochs). Therefore, we can see how it evolves over time.
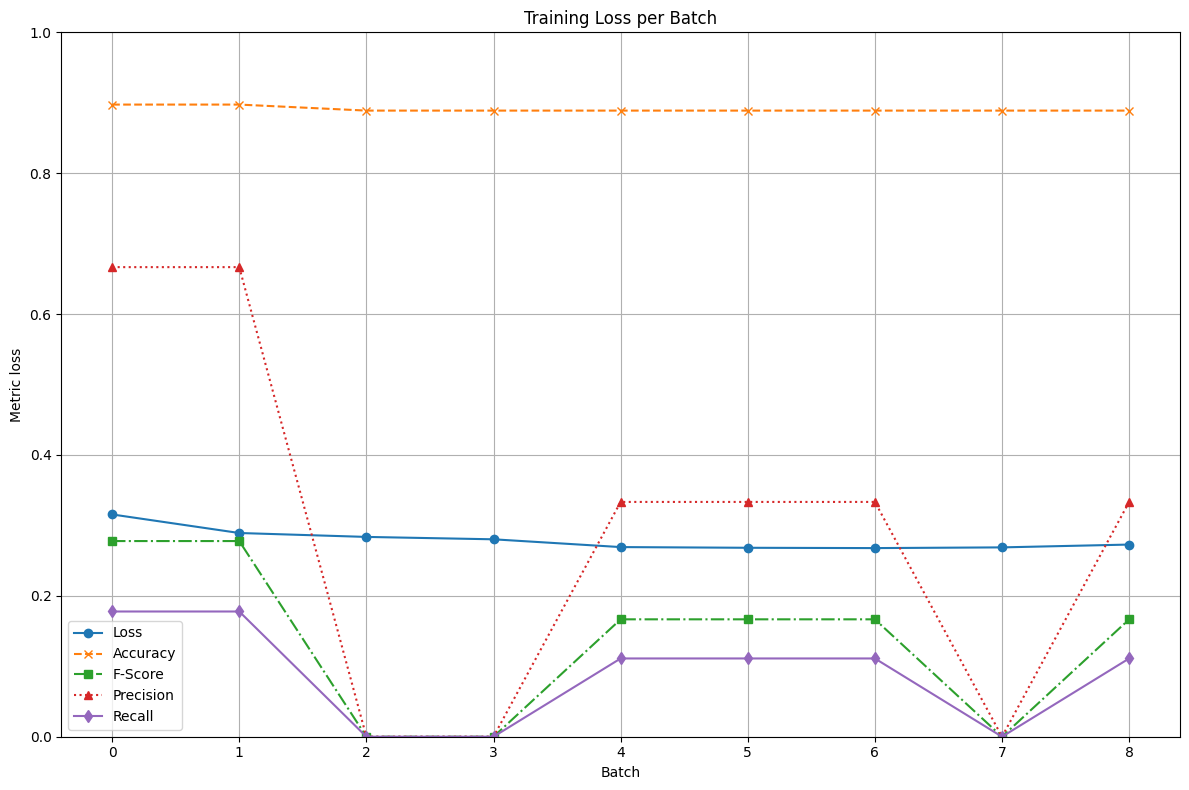
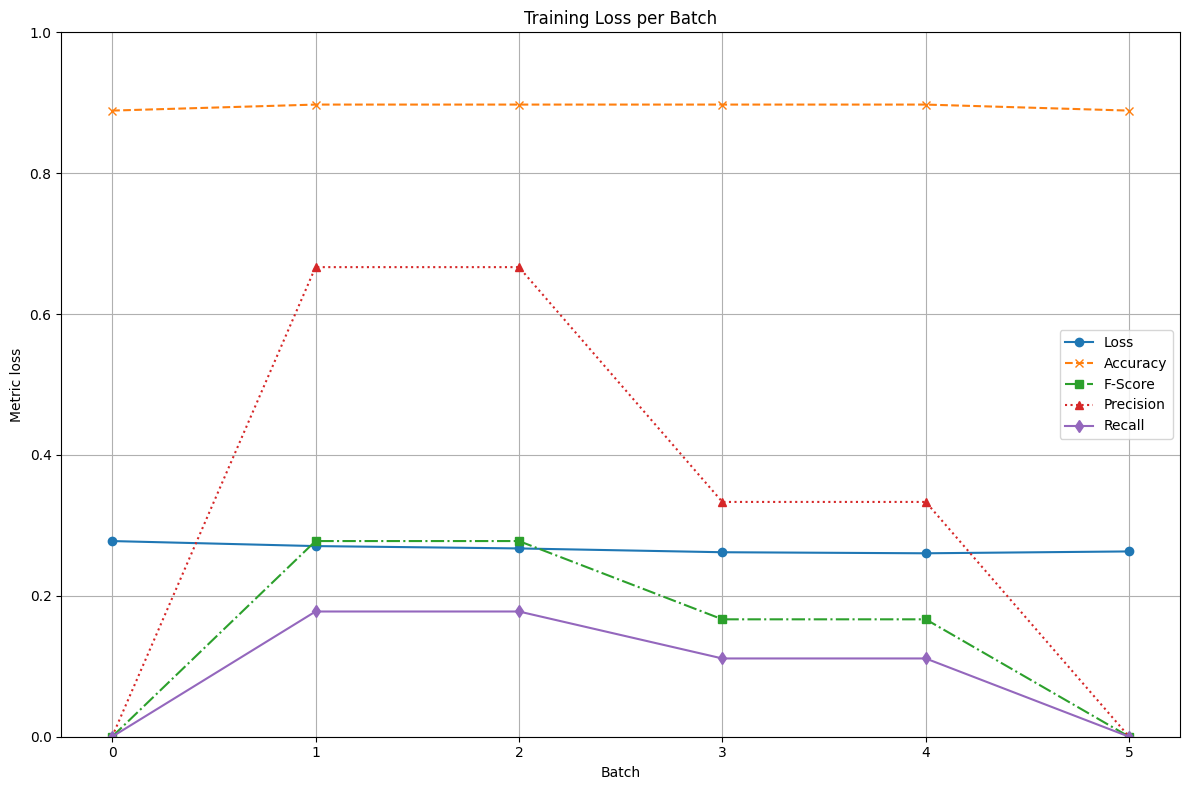
Unlikely, our big boys are not very strong, and they had a bad time training :(. The lack of computational power does not allow us to make more validation on this models, and therefore train longer and with better settings. We leave this as a learning taks for the reader. So now, let's compare the performance of the models.
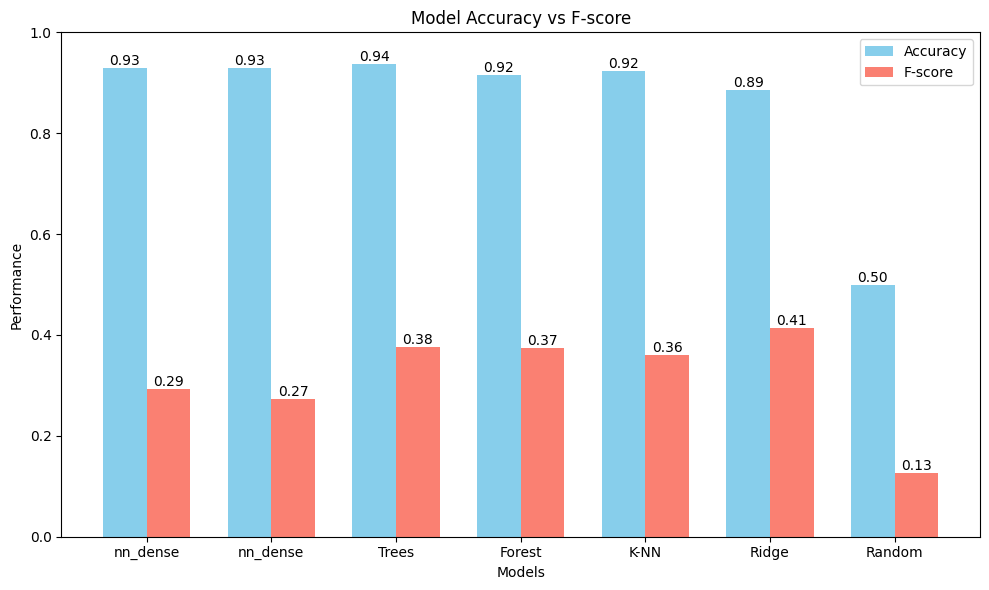
As we can see, all of them have a high accuracy and decent f-score. We also tried doing the predictions at random and as we can see, our models are better! Now, let’s see some of the predictions.
As we can see, all of them have a high accuracy and decent f-score. We also tried doing the predictions at random and so we proven that, our models are better! With this said, let’s see some of the predictions and give some use to the models..
| Movie Name | Original Genre | Predicted Genre |
|---|---|---|
| Eraser | Action/Adventure, Thriller | Action/Adventure, Comedy, Crime, Drama, Fantasy, Science Fiction, Thriller |
| The Violin Player | Drama | Comedy, Drama, Romance |
| Torn | Drama | Comedy, Drama, Romance |
| Spirit | Comedy, Drama | Comedy, Drama, Romance, World cinema |
| The White Flower | Old-fashioned/classical style | Comedy, Drama, Indie, Old-fashioned/classical style, Romance, Short Film |
BOOOM! Our ridgy guy get some of the genres right but then, add some other for you to be aware of any potential topics hahaha! Also, if the you remember the some of most common genres were drama and comedy. Therefore, the model learned that if most the movie are classified as ‘drama’ or ‘comdey’, he gets less punishment from the training judge.
| Movie Name | Original Genre | Predicted Genre |
|---|---|---|
| Hey Ram | Asian Movies, Drama, Historical, World cinema | Drama |
| Joshua Tree | Action/Adventure, Crime, Indie, Thriller | Drama |
| Killer Party | Horror | Drama |
The evidence is here, our neural networks did not manage. More work will be done in future version! But wait, not everything is lost, at the end, not all is drama, our forest manage to get good guesses.
| Movie Name | Original Genre | Predicted Genre |
|---|---|---|
| Hey Ram | Asian Movies, Drama, Historical, World cinema | Action/Adventure, Comedy, Crime, Drama, Romance, Thriller |
| Money Mad | Crime, Indie, Old-fashioned/classical style, Short Film | Comedy, Drama, Indie, Old-fashioned/classical style, Short Film |
| Savages | Crime, Drama, Thriller | Action/Adventure, Comedy, Crime, Drama, Thriller |
So, do you agree with what the models are saying (predicting)? ;)
Epilogue
The next day, after hours of searching, you have finally found it. The movie genre classifier is yours.
Will it work?
You smile… You can’t wait to find out!