Overview
The box office revenue of a movie is one of the most critical measurements of its success. The revenue of a movie can be affected by multiple factors. Internal factors such as topic and keywords in movie plots and actors as well as external factors like other movies released in the same period can have a large impact on a movie’s revenue. Studying the effect of plots, actors, and same-period movies on the revenue of movies can shed light on what movies should filmmakers make if they want to earn more, and can give an overview of the development of the movie industry. In this project, we first investigate what topics and keywords those blockbusters have in their plots to show the effect of movie plots. Then we try to find certain actors that can bring more money to a certain kind of movie but can potentially doom the revenue of other kinds of movies. Finally, we will show the effect of other top-selling movies on movies in the same period. The dataset we use, CMU Movie Summary Corpus, contains 81741 movies and 39088 of them have a plot. Among the 39088 movies, 10306 of them have revenue data after our data completion. We conduct our analysis on those 39088 movies and draw conclusions from those movies that have revenue data.
First, let’s look at the overall annual average revenue of movies, to have a rough glance at the development movie industry.
We can see that the average annual revenue of the film industry has increased over time (good to hear this!), reflecting the thriving development of the film industry and the enhancement of people’s purchasing power.
Question 1: What do those blockbusters have in their plots?
Plot is one of the most important elements of a good movie. A good plot can make the audience willing to buy a ticket, while a terrible one can doom a movie, no matter how cool the special effects are. We consider two perspectives to study the movie plots, namely topics and keywords. The topic is a top-down way of investigating the plots, looking at the overall frequency of words, namely bag-of-word modeling, while keywords are bottom-up manner, extracting information from a single movie plot and doing further grouping. First, let’s extract the topics from all the movie plots.
1.1 What are the topics in those movies?
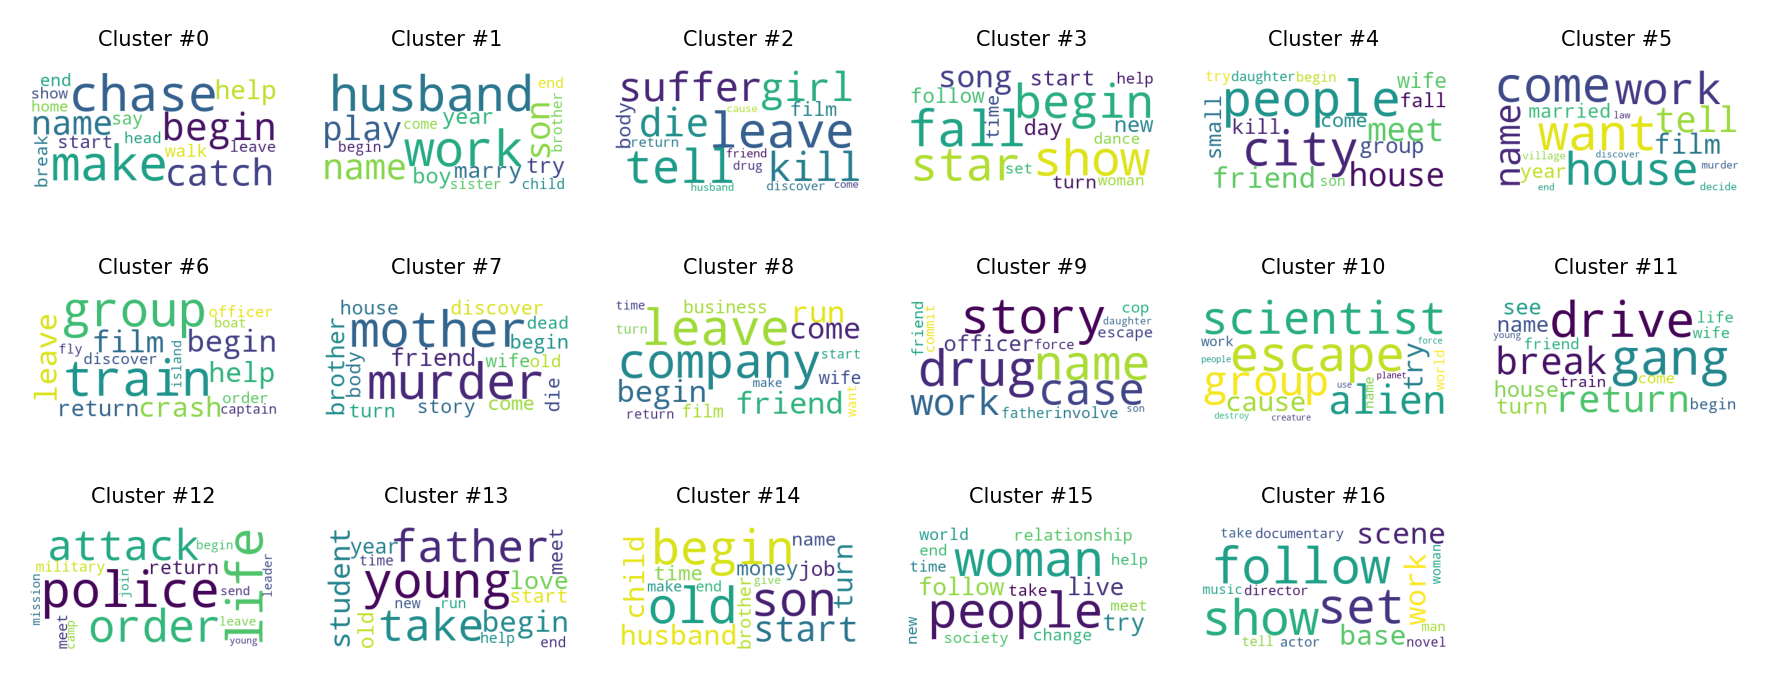
We first use topic modeling to extract 25 topics from movie plots and visualize the top 15 weighted words as a wordcloud in each topic.

Topics are different from each other. For example, topic 13 contains some negative words like “kill, destroy, attack” (Iron Man is in this topic) while topic 5 contains some postive words like “marry, love, life, familiy” (Mamma Mia! is in this topic).
1.2 Is the movie revenue in each topic group different from each other?
To see whether the revenue of movies can be affected by its topic, we first visualize the average revenue in each topic group and then quantify the pair-wise differences between topic groups. Here, we first visualize the average revenue in each topic group and then quantify the difference in a heatmap, with all values significant (p<0.05, 0 value means non-significant comparison).
Topics 4, 13 and 18 stand out on this figure and topics 13 & 18 have more compact CIs than topic 4. Looking at topics 13 and 18, they are all about “kill, fight, attack, destroy, escape”, and all of them are events that we rarely encounter in our daily life. We assume that people are willing to buy tickets for those kinds of movies because 1) Routine life sometimes is boring and people needs some excitement, and 2) The development of special effects creation in cinemagraphs make the expressiveness of those kinds of movies increase a lot while barely changing the movies with topics 15, 1, which are narrative movies about “interview” (topic 15) or “story” (topic 1). The two reasons can also explain why the aforementioned two topics, 15 & 1, have bad sales in average.
Those blockbusters typically contain “kill, fight, attack, destroy, escape” in their topics!
1.3 What are the keywords in the plot of each movie?
While topics provide a top-down view of all movie plots, it remains unclear whether we can group movie plots in a bottom-up manner, namely first looking at the important information in each movie plot and then trying to identify patterns in the collected important information. First, we define the important information in movie plots as keywords. We use KeyBERT to extract all unigram, bigram, and trigram keywords in each movie plot and turn each token in the extracted keywords into a pre-trained word vector. The sum of all keyword vectors then represents all the important information we summarize from a movie plot, defined as KeySum. We then use K-Means to cluster those KeySum into 17 clusters. Visualization of 10 of 17 KeySum clusters (to avoid clutter) is given below (reduce dimensionality to 2 for visualization using t-SNE).

Clear patterns can be seen from clusters of KeySum, supporting our claim that keywords can be used for another method than topics for grouping movie plots. However, one subtle point could be that keyword clustering just repeat what topic modeling does. To eliminate this doubt, we visualize the distribution of topic id in each keyword cluster.

Different topics appear in the same keyword cluster, supporting our seperated analysis on both topics and keywords. Moreover, it shows that topics and keywords are indeed two perspectives of viewing the movie plots.
We also visualize 15 top-frequent tokens in each keyword cluster, similar to the visualization of topics, to look into each cluster of what words are in it.
The frequent word in topic modeling, such as “kill” or “fight”, have disappeared in keyword analysis, which proves once again that topics and keywords are different from each other.
1.4 Is the movie revenue in each KeySum cluster different from each other?
Finally, we can investigate whether the revenues are different in different KeySum clusters. Similar to analysis of topic groups, we first qualitatively visualize the KeySum group average and then do the quantification.
Two salient KeySum clusters appear, i.e., cluster 6 and 10. The word “train”, in cluster 6, is not a noun but a verb. Why is that? Let us explain via two examples. Star Wars Episode I, The Avengers and other movies that are about a group of people to be trained are in that cluster (Star Wars Episode I, trained to be Jedi; The Avengers, a group of superhero is trained to form an organization). Cluster 10 is more easy to comprehend (Sci-Fi-like keywords!). We assume that people expect the growth of the characters (that’s why they need to be trained), even if they are already strong individuals, rather than watching a superhero being invincible for two hours (typical movie length!). Moreover, like we have expected, the sci-fi-related keywords are preferred by audience. Movies in cluster 10: Avatar, Transformers: Dark of the Moon, Spider-Man 3, etc.
However, we also notice several worse-selling KeySum clusters, such as 1,3,5,16. Looking at the keywords, they are all about some daily routine plots. Especially all the keywords in cluster 1, are about soap operas. We are not saying that these kinds of movies are bad, because movies like There's Something About Mary, Shakespeare in Love are in these clusters. However, we do claim that including those words in the movie plots cannot bring you much revenue!
The keywords in those blockbusters’ plots are often related to “a group of people being trained” and Sci-Fi-related words like “aliens, scientist”!
1.5 Are movies of different genres share the boost-selling tricks for writing the plots?
So far, we have come up with several suggestions on how to make a movie plot to help the movie earn more money, and how to avoid things in the plot that might undermine the movie revenue. However, a commonsense would be that A question now would be, do movies of all genres share those suggestions? To answer it, we want to quantify the overlapping between top-selling topics and KeySum in each genre, and the overall top-selling topics and KeySum clusters. We propose to use Jaccard index to quantify the distance between two lists of indices, where indices can be topic id or KeySum cluster id. First, let’s look at the topics.
1.5.1 Quantifying the overlap between overall top-selling/worse-selling topics and those in different movie genres.
We first extract top-10 top-selling and low-selling topics overall (10 topics are 40% of all topics, which can be regarded as top-selling ones). Then, for all movies belonging to each genre, we also extract top-10 topics similarly. We plot the Jaccard distance between those top-10 topics in each genre and the overall one.
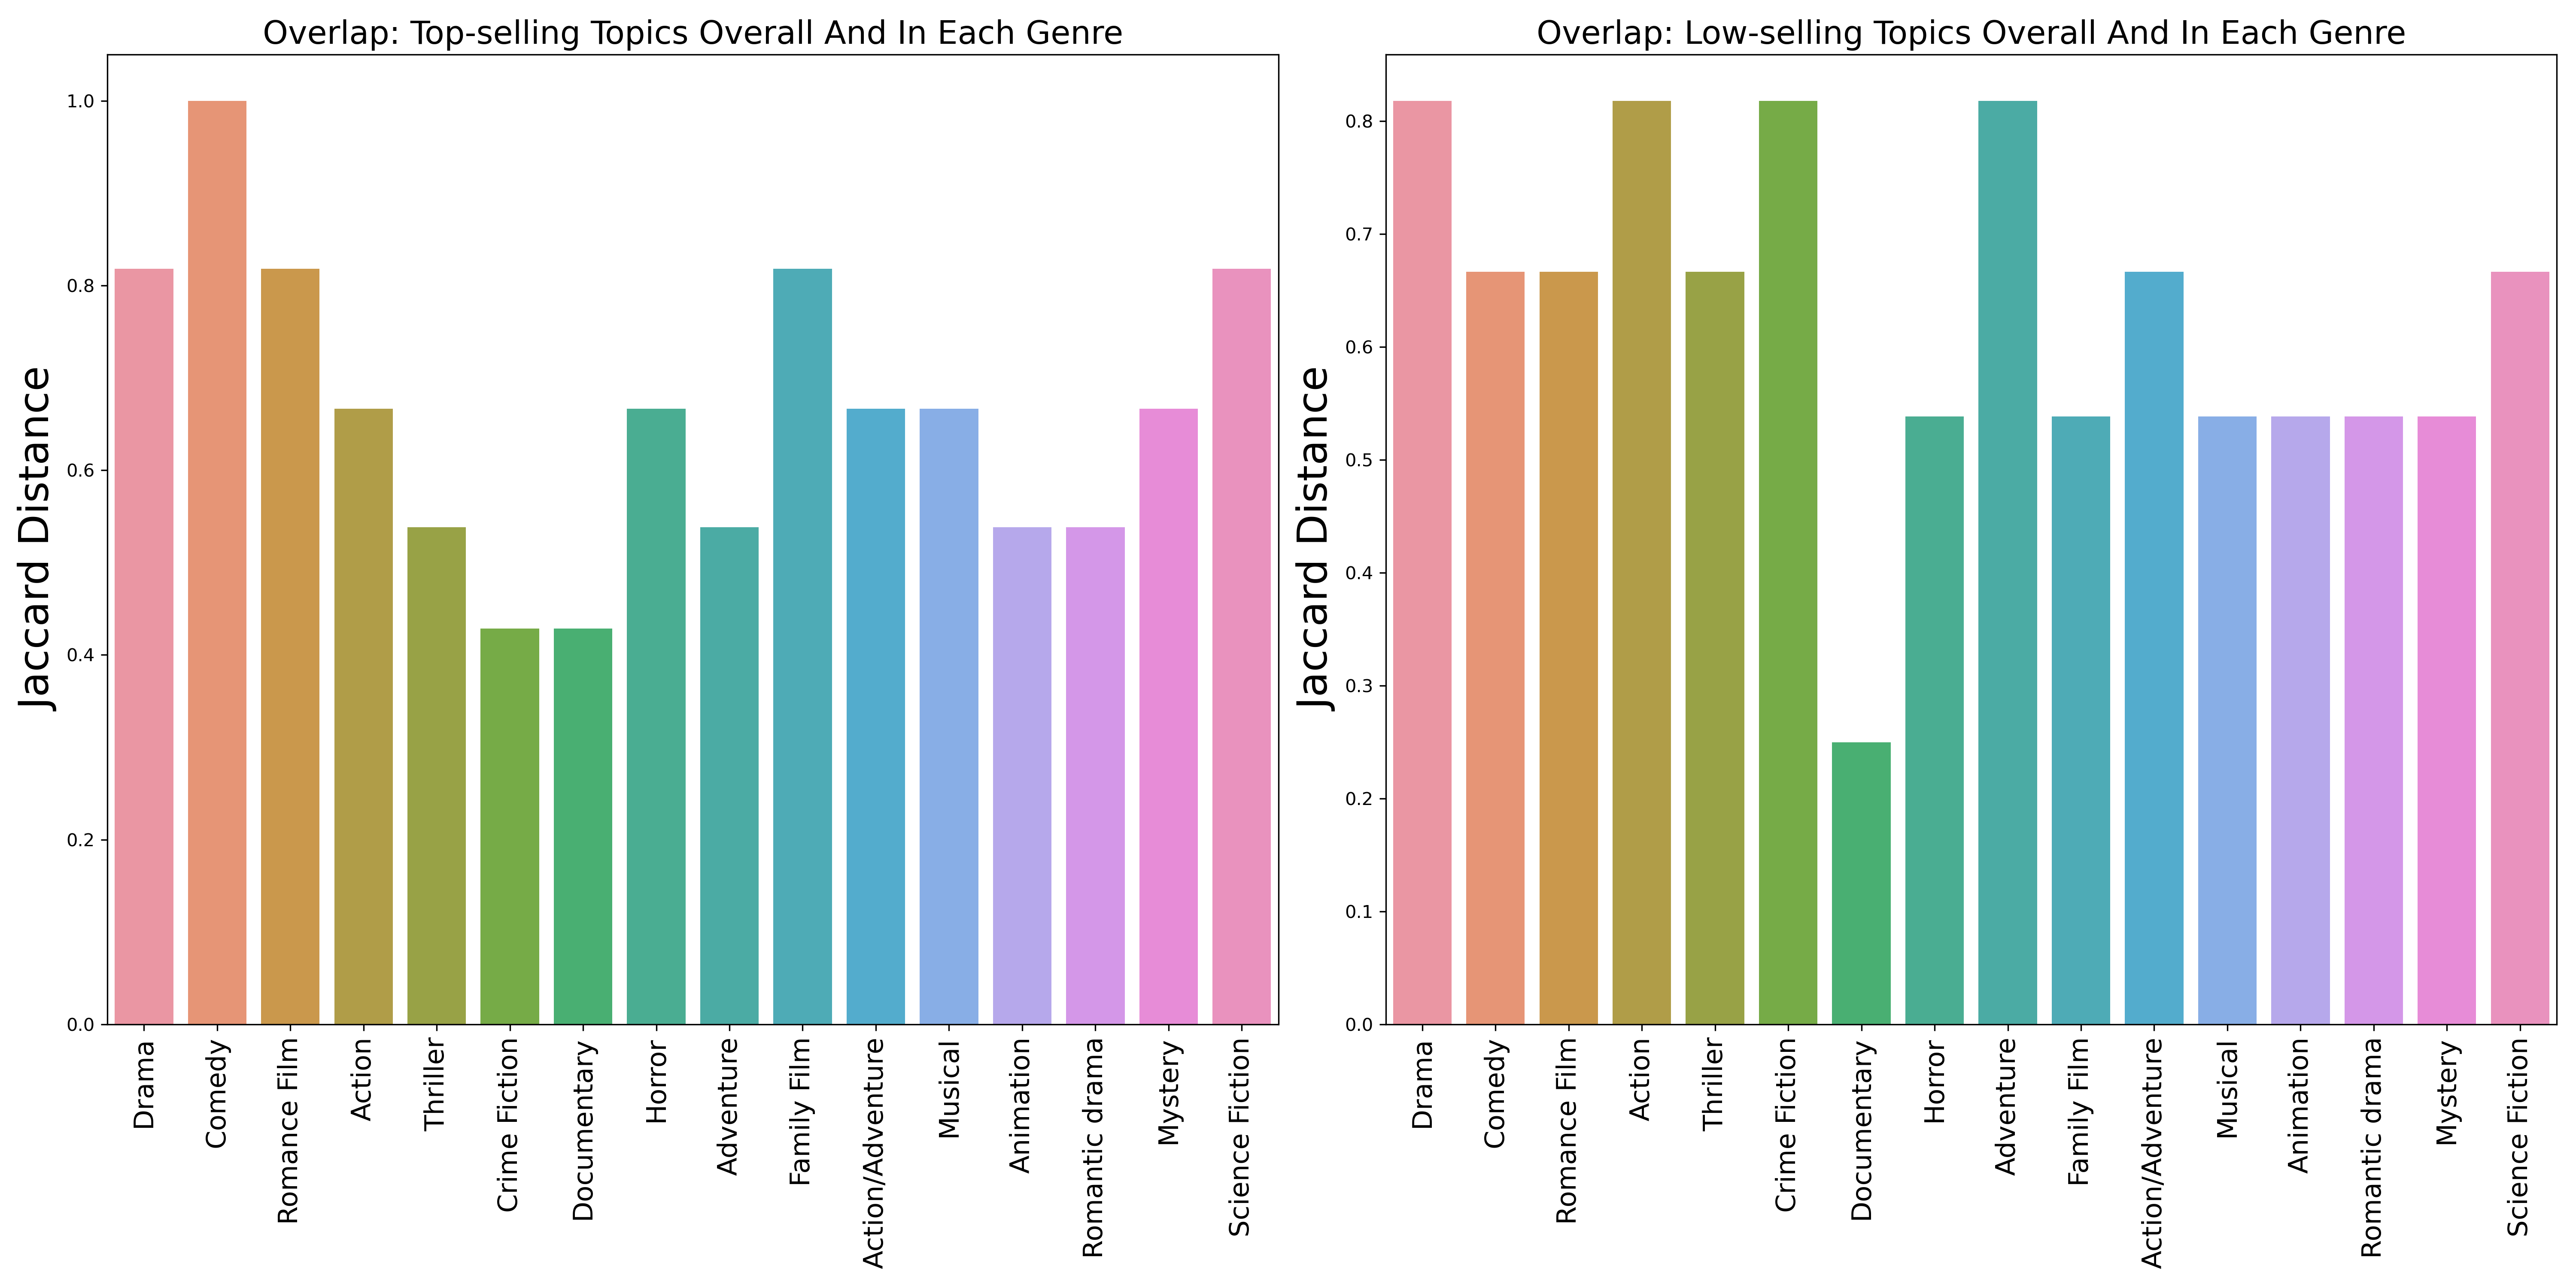
The first thing to notice is that some of the Jaccard indexes are too high, like why does the genre “Comedy” need topics in 4, 18, 13 (contains “kill, fight” etc.)? The reason is that the movie genre is quite loose. For example, if an Adventure movie contains some has some comedic elements, it will belong to Comedy genre (Pirates of the Caribbean: At World's End is both Adventure and Comedy!). This phenomenon reflect that introducing comedic elements into movies related to “kill, fight, attack” can also bring more revenue.
In the top-selling part, we observe that “Documentary”, “Indie”, “Crime Fiction” overlap not so much with the overall topic-selling trend, while in the low-selling part, the weird genres become “Documentary” and “Indie”. Little overlapping indicates that movies in these genres cannot adopt our suggestions, and need specific treatment. We further extract the top-selling and low-selling topic ids in those movie genres, and exclude the overall top-selling and low-selling topics, to provide more specific guidance for what should those movies include in the plots.
| Movie Genre | Top-selling Topics | Low-selling Topics |
|---|---|---|
| Crime Fiction | 24, 8, 17, 6 | 11 |
| Documentary | 3, 7, 15, 24 | 9, 6, 17, 22, 8, 13 |
We observe that for Crime Fiction, it seems a bit weird that the top-selling topics include some topics that are not related to “Crime”, namely 24 and 17. That’s because the movie plots focus more on the background of crimes instead of the crime itself, like movie Sister Act and Dangerous Minds. For Documentary, as we have expected, this kind of movie needs to be as realistic as possible to attract people, and that’s why topic 7,15,24 can bring more revenue to Documentary. Moreover, people need some documentaries on crimes for society to learn a lesson, and this is why topic 3 is in top-selling topics in documentary (e.g.,Crime After Crime). However, some documentaries about war or other heavy topics in real world might cause oppressive atmosphere and make people not want to watch the movie, like Into Eternity. That’s why topic 13, 8 etc are in the low-selling topics in Documentary.
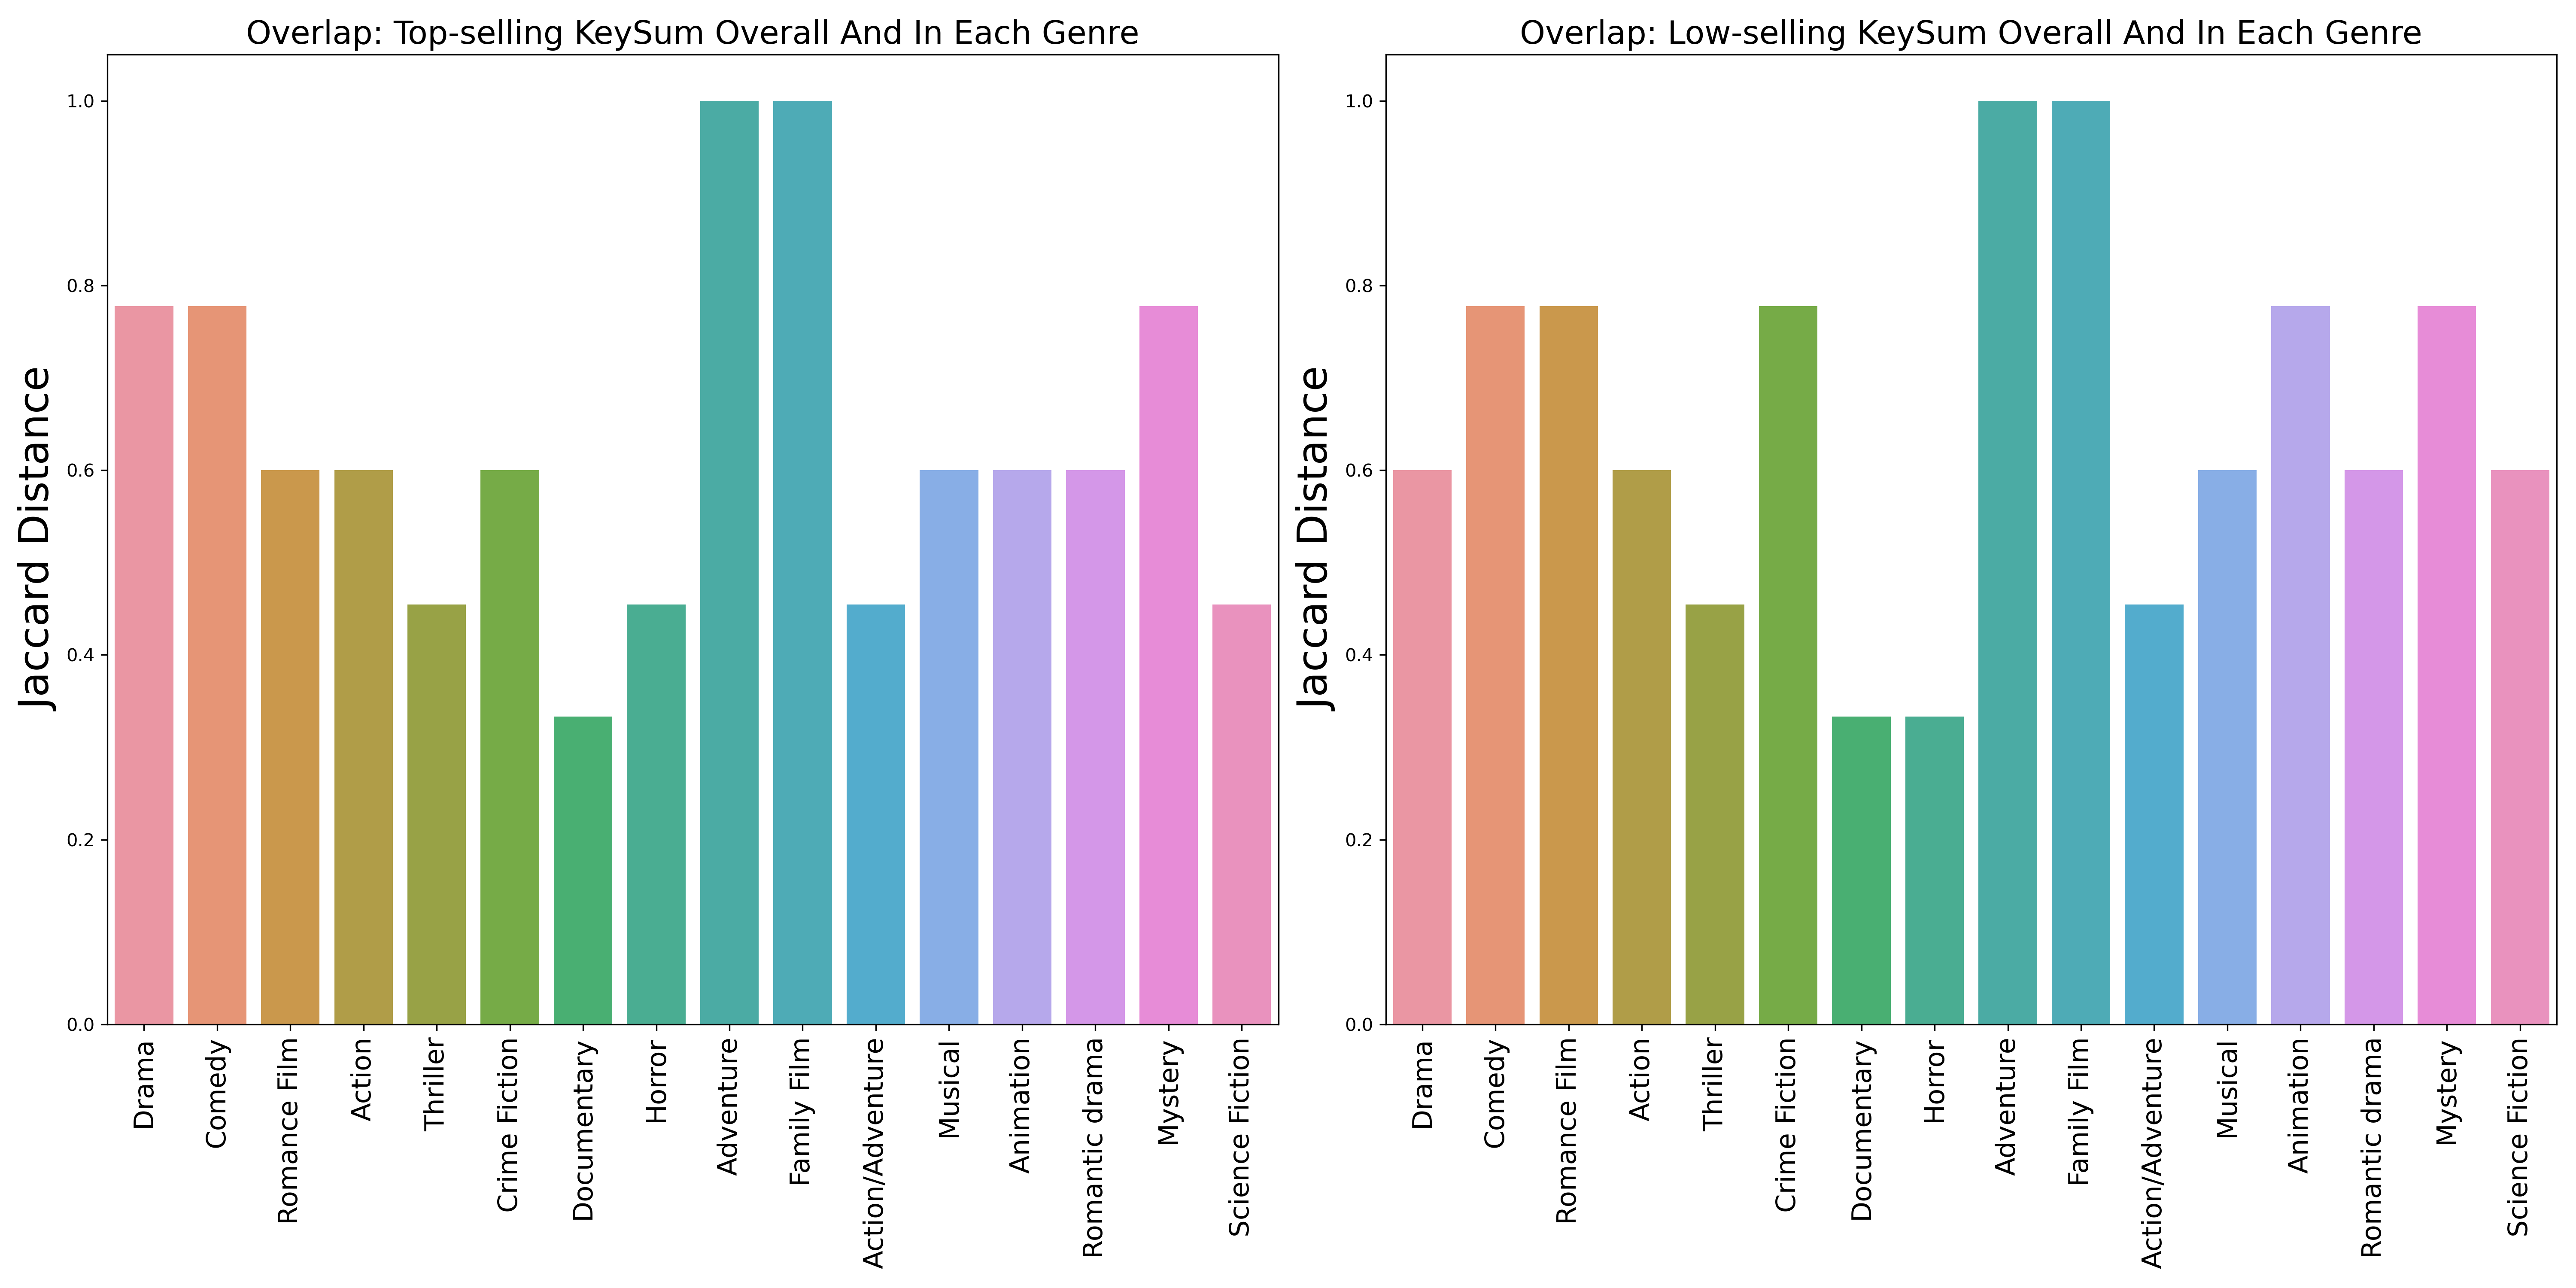
1.5.2 Quantifying the overlap between overall top-selling/worse-selling KeySum clusters and those in different movie genres.
Similar to the analysis for topics, we extract top-8-selling and low-8-selling (~47% of all KeySum clusters) KeySum clusters and perform similar analysis as in topics.
| Movie Genre | Top-selling KeySum Cluster | Low-selling KeySum Cluster |
|---|---|---|
| Documentary | 4, 8, 16, 3 | 6, 0, 14, 2 |
| Horror | 5, 9, 3 | 0, 11, 14, 8 |
Again, Documentary appears! Similar to the aforementioned reasons, movies belonging to Documentary have different top/low-selling topics than others. Moreover, Horror movies have a different low-selling topics than the mainstream, indicating that filmmakers need to pay extra attention to those keywords in plots when making Horror movies. All those keywords are about the daily routine, which is hardly horrible.
To filmmakers of Documentary, Horror, and Crime Fiction: Do not follow the crowd! Adopt genre-specific strategies!
1.6 Is the average revenues of topic and KeySum groups unchanged through time?
1.6.1 What is the trend of revenue of each topic and KeySum group?
While investigating the movie revenue throughout the whole time, we must be aware that the trend in the movie industry might change with time. A question would be, what is the trend of revenue in each topic and KeySum group? Again, let’s begin with the topics. We visualize the average revenue every 5 years for each topic, and build a regression model with time as independent variable and revenue as dependent variable to quantify the trend in each topic.
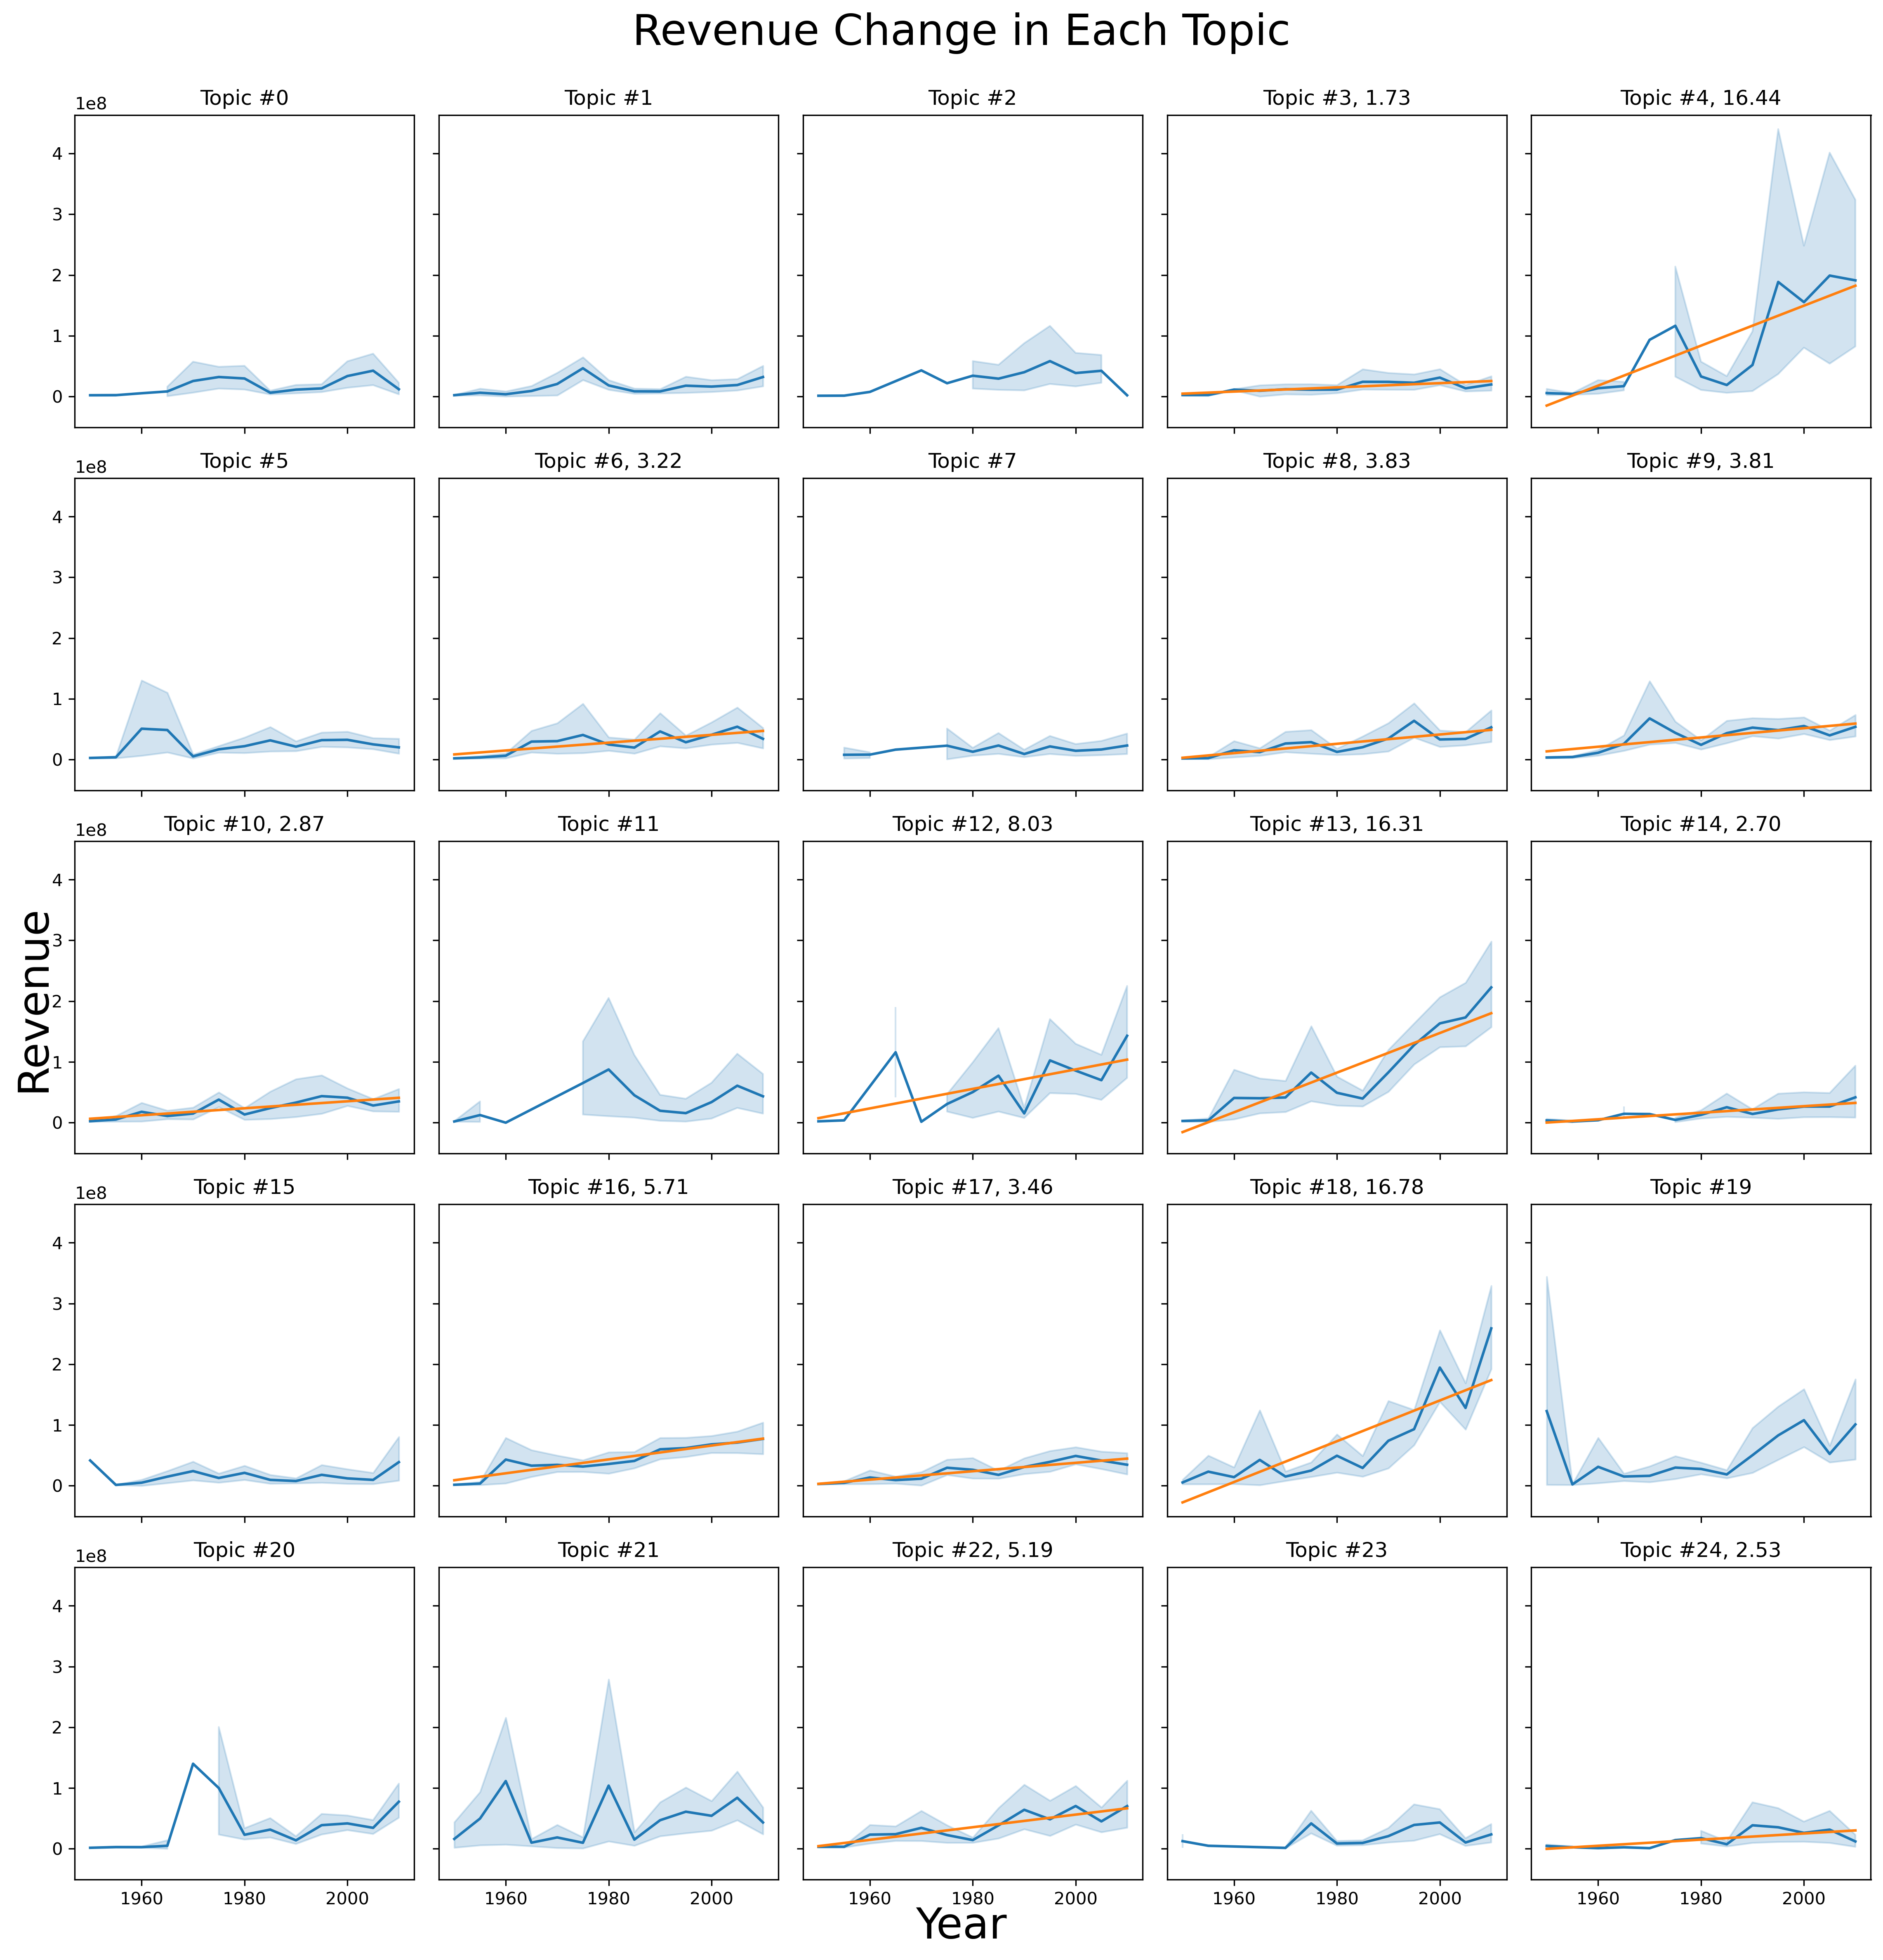
All the figures with a regression line have a significant coefficient for the independent variable “time”, whereas the ones without do not. We observe that topics 4,13,18 have the most salient growing trend among all topics, and the three topics are exactly the same as we found in the overall top-3-selling topics. Hence, we not only demonstrated that those 3 topics are all money-making ones on average but also showed that they have an increasing trend in revenue, indicating that those 3 topics are excellent investment directions. We have talked about topic 13 and 18 before, but haven’t introduced topic 4. It is related to adventure and action type of movies that focus on sailing, like pirate, island and other imageries that are related to sailing. Apart from these top-3 topics, we also notice that topics 12, 16, 22 have a large and significant growing trend, indicating that those 3 topics are rising stars in movie industry. Great movies like Despicable Me (topic 12), The Da Vinci Code (topic 16), The Last Samurai (topic 22) appear.
Similarly, let’s see what happens in the KeySum clusters.
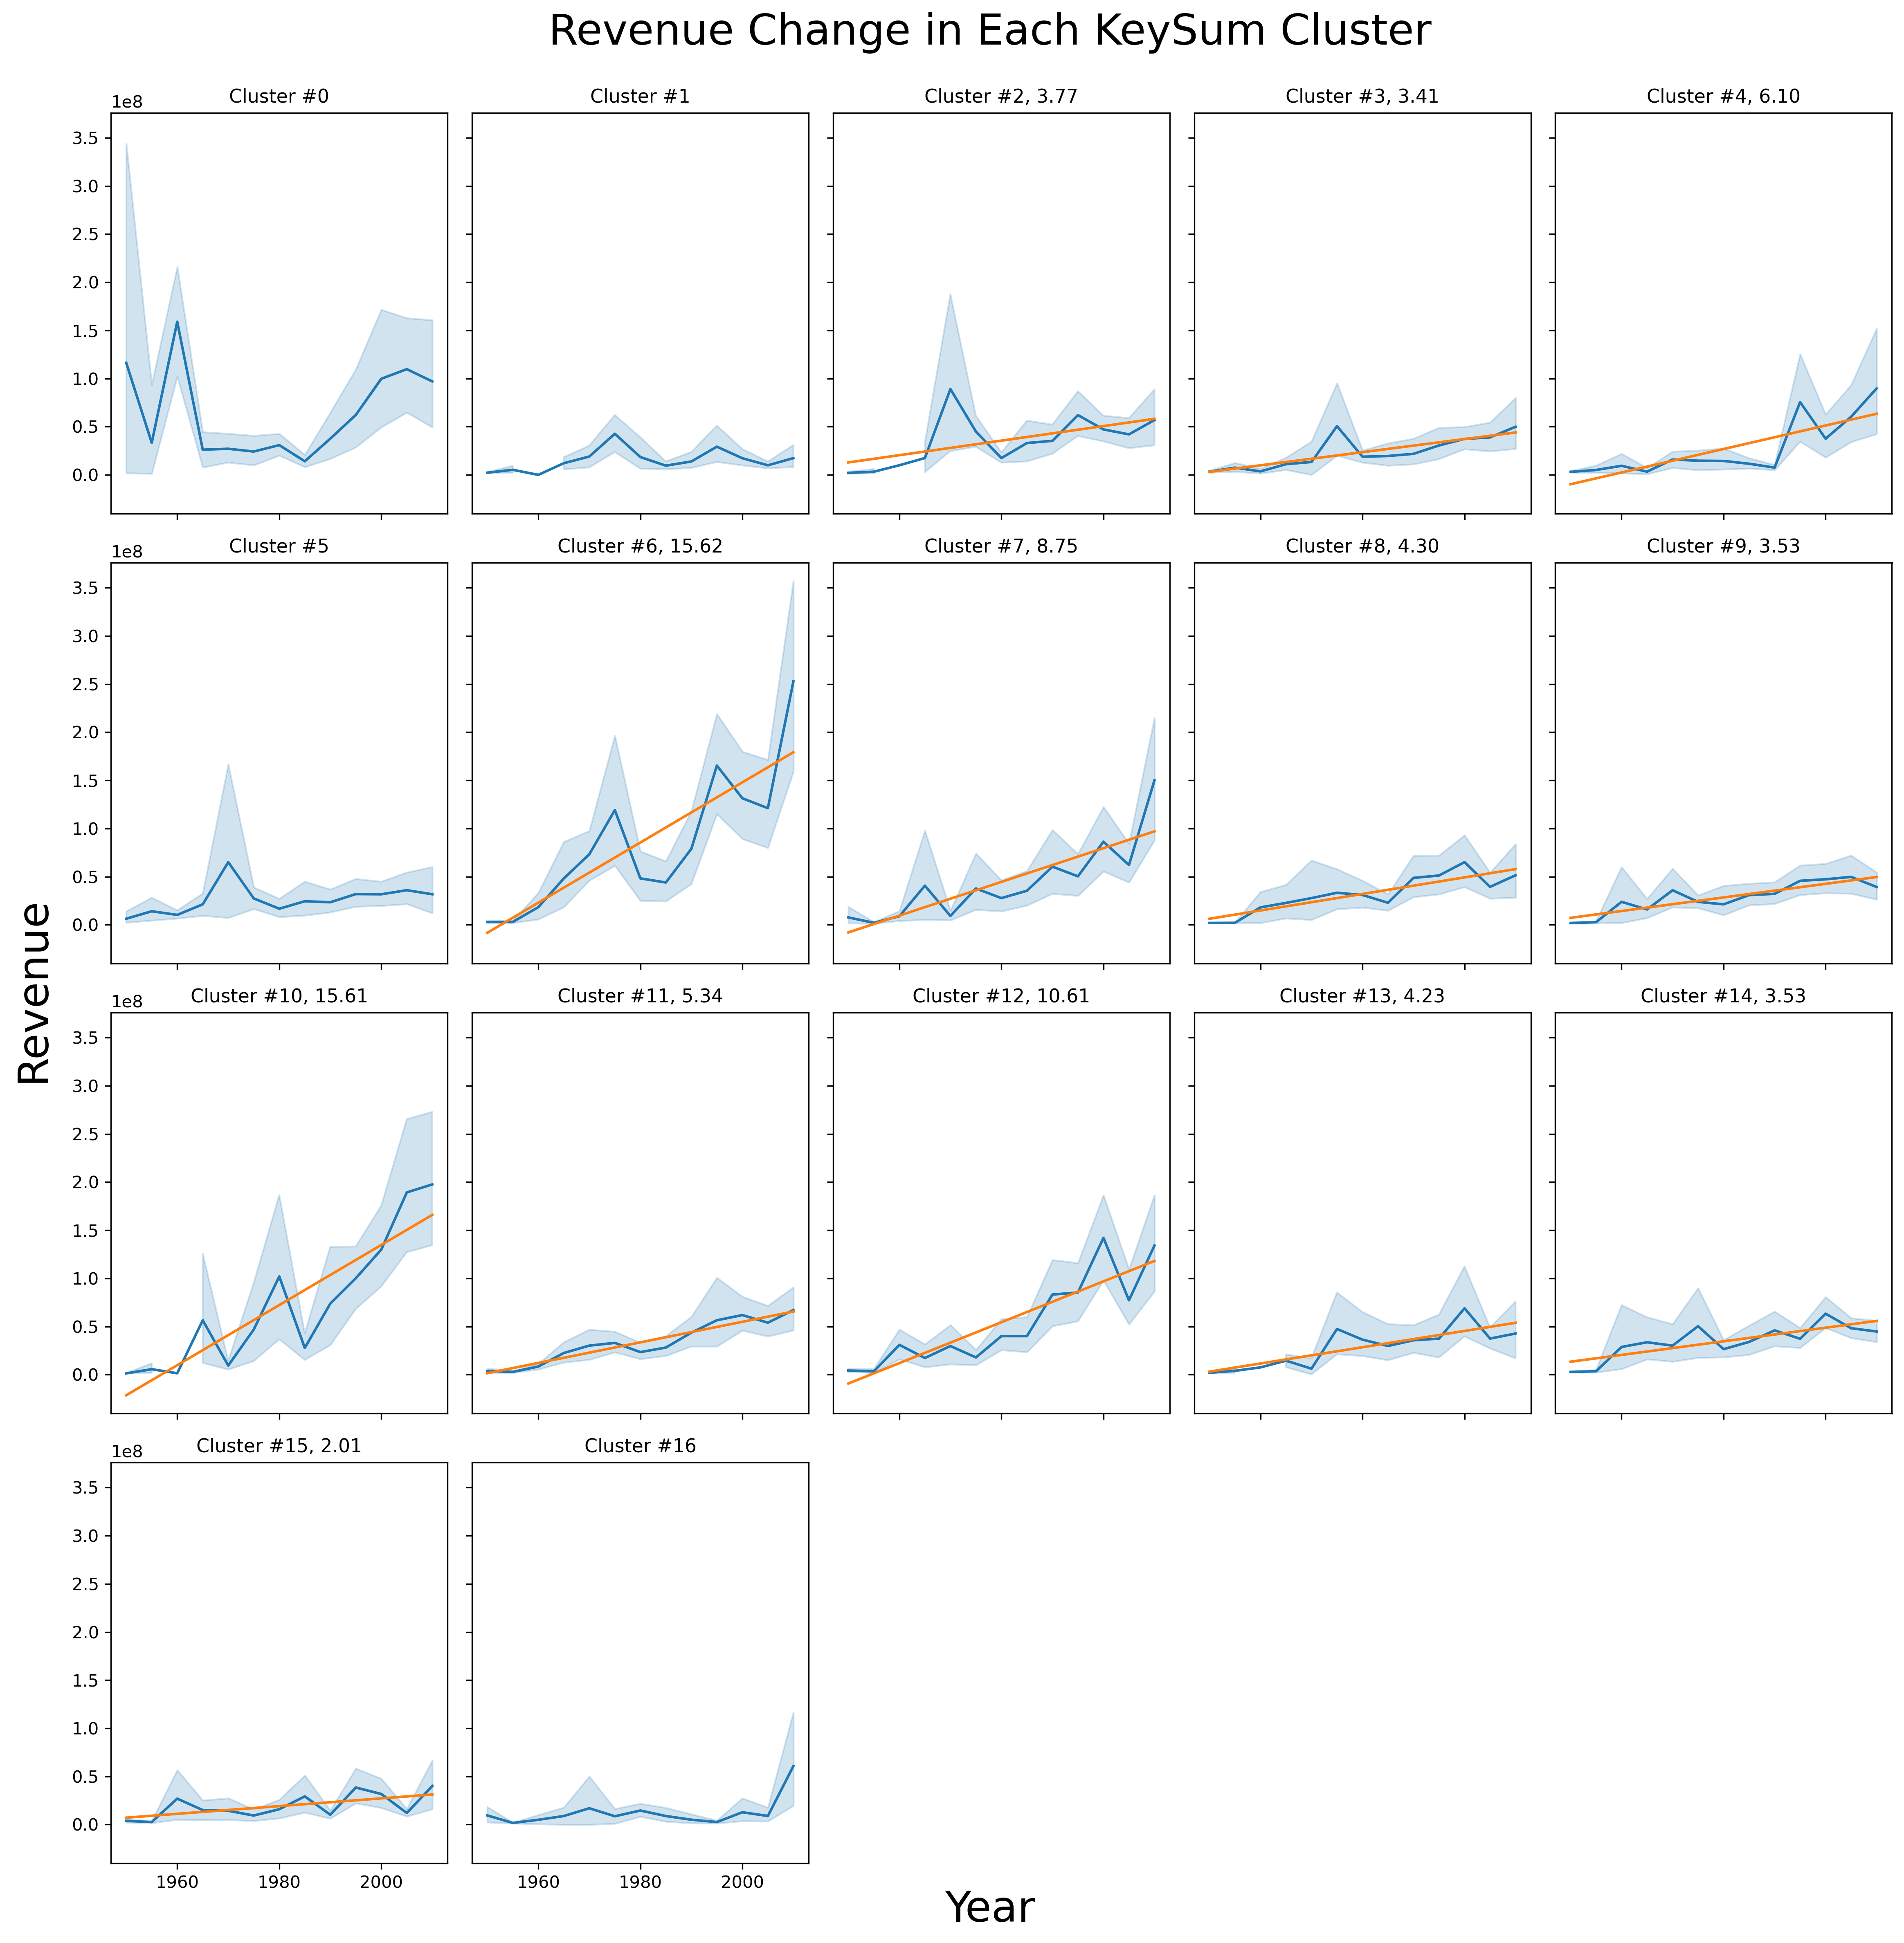
KeySum clusters 6 and 10 stand out from the figure. However, the third best-selling KeySum cluster, 0, is not increasing with time. Looking at that figure, we even can identify a decreasing trend recently. This shows that cluster 0’s overall success attributes to its past but not present, and thus making movies with keywords in cluster 0 in the plots is not a good option.
Cluster 7,11,12 are 3 rising KeySum clusters. They either include some critical turning-point-indicating words like “murder, die, attack” (7, 12) or some imageries that are not so common (at least to us ordinary people) like “drive, gang”. Here drive is not driving a normal car but more in a racing manner, such as movie Cars.
1.6.2 Comparison of movie revenues of different topic or KeySum groups through time
We have investigated the change of movie revenues in each topic and KeySum group. However, the comparison between those groups are only implicitly manifested in the figure. To explicitly see which topic or KeySum group is the winner at each time period, we synthesize a video of the average revenues in each topic and KeySum group. Interpolation of revenue data is used to make the video looks smoother, and this is why the year data has decimal point. First, let’s look at topics.
The order of the y-axis is the overall ranking of different topic groups. We can see that the overall top-3-selling topics are not the winner before 1990s. Before 1990s, topics 12,21,20,11 dominate in turn. Those topics are not about the topics that we suggest include in the plots but contain more daily imageries, like “family, friend, school, villege”, etc. We assume that those things do not need special effects to show the underlying ideas of the movie but the top-selling topics all need. You cannot make “killing, attack” look realistic without advanced special effect techniques! This is why the overall top-3-selling topics did not perform well before 1990s. With the advent of good special effect techniques introduced in the 1990s, topic 4,13,18 start to chase and become the dominant (movie Terminator 2, Titanic, Jurassic Park use lots of special effects to tell the story, and all of them appear in the 1990s).
The order of y-axis is the overall ranking of different KeySum clusters. The first thing to notice is that cluster 0 dominated before the 1970s and becomes weaker and weaker after that, which meets the conclusion we claimed above in 1.6.1. Throughout the time after the 1970s, cluster 6,7,10,12 never lost against other clusters. The reason for clusters 6 and 10 to win are same as we mentioned in 1.4, that people expect expect the growth of the characters in the movie and sci-fi-related imageries. For 7 and 12, similar to what we analyzed in 1.6.1, critical turning-point-indicating words are always preferred!
Be careful about the outdated keywords in plots, and be bold on investing the rising star topics!
Question 2 Are actors only good at performing movies with certain plot content?
A well-known thing is that some actors are perfect fit for certain kinds of movies, but they might doom other kinds of movies due to their own profiles (imagine Schwarzenegger or Dwayne Johnson in Love Film!). Can we identify those actors that are with specialty, namely only good at performing movies with certain plot content?
To answer this, we first reuse the two perspectives of movie plot content, i.e., topics and keywords. For each actor, we first extract the top-5-selling movies and low-5-selling ones, and compute the difference between the average revenues of those two groups. We define such a difference as the range of an actor, similar to the mathmatical definition of “range”. To quantify the difference between the plots of those top-selling movies and low-selling ones, we propose to use the distance between word vectors in topics and keywords, to semantically measure how far is it from the plots of one group of movies to the other. Concretely, we sum all word vectors in all topics or keywords of a group of movies, obtaining the topic-sum vector and keyword-sum vector of a group of movies. Then, the cosine distance between the topic-sum and keyword-sum vectors becomes the distance between two groups of movie, and the cosine distance naturally becomes topic-sum distance and keyword-sum distance. We use such a metric to quantify the semantic distance between two groups of movies. We plot the two distances of an actor as well as the range of the actor.

We define an actor with topic-sum distance larger than 0.1 or keyword-sum distance larger than 0.08 as actors with specialty. We can see that many actors have a relatively large topic-sum distance or keyword-sum distance, and all those actors have a range roughly larger than 0.2 billion, which is quite a huge number in movie revenue. As a side effect, we also observe significant but not so strong correlations in both figures (R2 0.111, p < 0.001 for topic-sum distance, R2 0.143, p < 0.001 for keyword-sum distance), indicating that there is a small correlation between the semantic distance of movie plots and the movie revenue for all actors. However, a question would be that whether the defined distance metric really reflect what we human think. We pick four actors to visualize the words in their top-selling and low-selling movies. All the actors are actors with specialty.
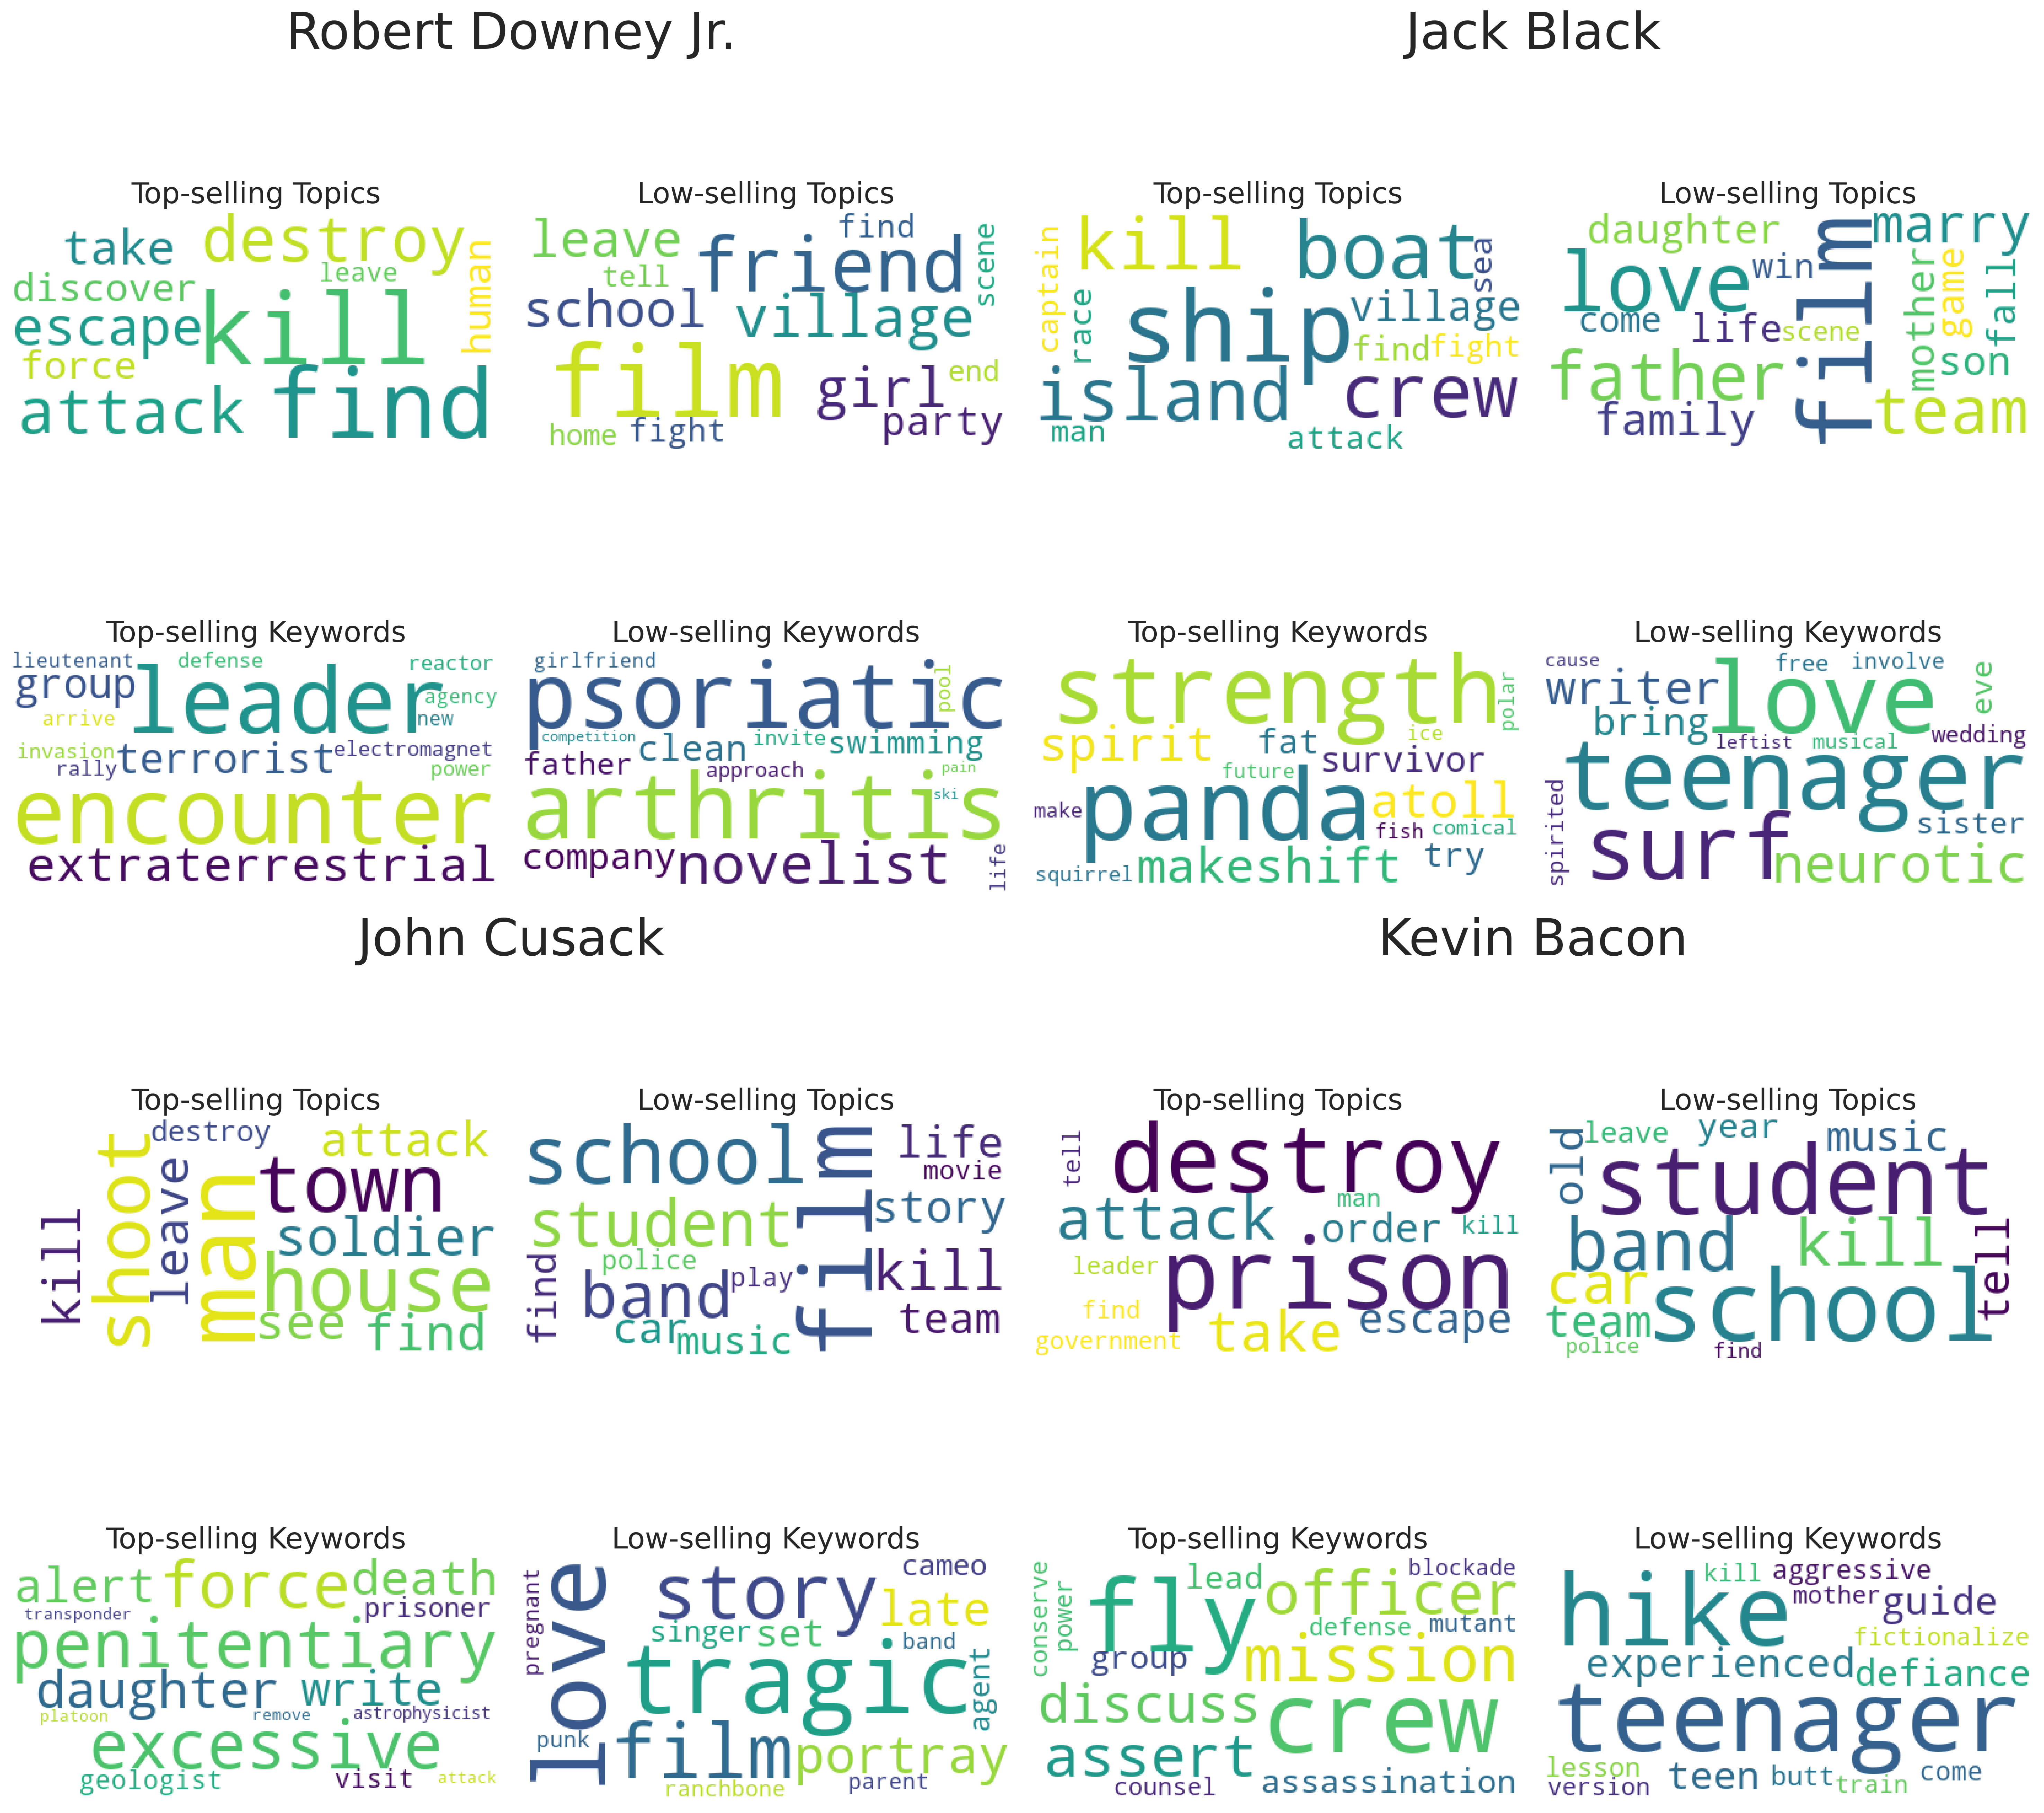
We can see that the words in top-selling part and low-selling part are different, such as “kill, destroy” vs. “friend, party” in “Robert Downey Jr.”, “ship, island” vs. “love, father” in “Jack Black”, etc. For example, we all know that Robert Downey Jr. is very good at performing Iron Man and some critics even highly praised him as “Real Tony Stark”. And, certainly, his top-selling movies are Iron Man and Avengers, which are all about performing Tony Stark. However, his low-selling movies include Friends and Lovers, Two Girls and a Guy and other Love Film, indicating that he is not good at performing screen couple.
Question 3 External Factors: Do top blockbusters have any influence on the movies released in a close period?
It cannot be denied that movies’ inherent character dorminates their final revenues. Nevertheless, people tend to neglect that an inappropriate release date could be fatal to a movie despite its high quality. For example, Shazam got the 6th highest score among all DC movies in Rotten Tomato but still suffered from a terrible box office since it was released in the same month as Avengers: End Game. To analyse such impact, Let’s first give a naive definition of top blockbusters
3.1 What is a top blockbuster
There is no quantitative definition about blockbuster given by the film industry. Therefore, we give a simple and clear definition of top blockbusters. We simply define them as the annual box office champions. However, based on their revenue, we can also refine the blockbusters to different levels(eg. With box office revenue higher than 1 billion,2 billion…)
3.2 How do we define movies released in a close period with the top blockbusters
Given some empirical knowledge about the historical box office, we give a preliminary definition for movies released in a close period with the top blockbusters: Movies that are released in the same month with the top blockbusters are considered to be released in a close period.
3.3 Initial analysis
We first made a null hypothesis that the top blockbusters don’t have any influence on the movies released close to it, so that the average revenue of closely-released movies and non closely-released movies should be the same. We did a t-test on the movies released within the same month with the top blockbusters and the movies released within the same year but not the same month with the top blockbusters. The blockbuster selection standard and their corresponding blockbuster numbers and ratio of p value smaller than 0.05 are illustrated in the following table.
| Blockbuster selection standard | blockbuster numbers | ratio of p value smaller that 0.05 |
|---|---|---|
| Annual revenue champion | 52 | 0.19 |
| Movies with revenue higher than 1 billion | 13 | 0.15 |
Based on the t-test, under most circumstances, the null hypothesis should be accepted, since only 15% - 19% of the selected blockbusters have a p_value smaller than 0.05. However, this conclusion could be inaccurate since comparing the average revenue is not enough. To conduct some further analysis, we select one blockbuster Pirates of the Caribbean: Dead Man’s Chest(2006). It has a positive statistic value(2.83) and a p_value less than 0.05. It seems to suggest that this perticular blockbuster has a positive influence on the movies released close to it.
But is that really the case?
3.4 Further analysis
Based on the previous analysis, we can see that the blockbusters don’t have a significant influence on the closely-released movies on average. However, it could be the case that those movies’ own quality offsets the influence brought by the blockbusters. Now, we want to rule out the influence from high-quality and low-quality films and analyse the blockbusters’ impact on movies with a medium quality. Therefore, instead of using average revenues, we choose to use median revenues.
We chose the movie with the median revenus from all the movies released in the same month with our selected blockbuster Pirates of the Caribbean: Dead Man’s Chest(2006). The chosen movie with median revenus is called Waist Deep and it has a revenue of 21344312 lower than the average revenue of the non closely-released movies(47450260).
To analyse the impact on different genres, we also compared the revenue of Waist Deep with the annual averages of all its genres. The results are demonstrated below.
As illustrated in the figure above, one film could have several genres. The selected film with the monthly median revenue has negative gaps from the annual averages in all its 6 genres, which means it has a lower revenue compared to the average in all of its classified genres.
3.5 Rule out the influence of released months
Hordes of film analysts, more often than not, tend to believe that movies released in different time of the year, even with close topic or genres, have considerably different possibility to reach a high revenue. One classic argument is that movies released between Halloween and Christmas have a much higher chance to get higher revenue than movie released during spring(March,April). One can easily finds tons of examples.(eg. Frozen vs Monsters University, Spider-Man: No Way Home vs Black Widow)
To rule out this potential influence, we also compare the revenue of our selected movie with the average revenue of movies from its genres that are released in the same month of the previous year and the next year. For example, since our selected movie Waist Deep is released in June,2006. We will compare its revenue to movies with the same genre that are released in June,2005 and June,2007. Mind that we also make sure that the blockbusters from previous year and next year in our case are not released in the same month from our selected movie
As we can see from the two figures above, the revenue of our selected movie Waist Deep is lower than the average revenue from same month previous year and next year in most of its genres. We can also notice that the seleted movie always shows only a positive gap in the genre Gangster Film. This might indicate that Waist Deep is a high quality movie in this specific genre, enabling it to overpower of negative influence of the top blockbuster.
Conclusion
For answering the first question, i.e., what do those blockbusters have in their plots, we conduct several analysis on the relationship between key informations in movie plots and movie revenues. We identified several top-selling topics and sets of keywords that the movie plots should include, via group comparison and visualization. We also investigate whether different genres of movies have different dominating topics and keywords, and provide analysis and suggestions on those special genres. Moreover, we correlate the movie revenues with time, and successfully identified some rising stars in topics and keywords, but also outdated ones that filmmakers should avoid.
For answering the second question, namely actor with specialty, we define the range of an actor as the difference of revenues in top-selling movies and low-selling ones, and try to find whether the movie plots of those top-selling and low-selling movies are semantically different. We reuse topics and keywords in part 1 and define topic-sum distance as well as keyword-sum distance to quantify the semantic distance between two groups of movies. We identified actors with specialty using those distance metrics and also discovered certain correlation between the movie semantic distance and the range of actors, indicating that actors in movies with different kinds of plots can either contribute or undermine the movie revenues. Finally, we visualize the words in top-selling topics and keywords as well as low-selling ones, to confirm the validity of our proposed distance metrics between movies.
For the effect of other movies on a movie’s revenue, we analysed the influence of closely-released top blockbusters. The statistical analysis suggests that the impact of top blockbusters are not significant on average. This could be explained by the fact that the qualities of the movies themselves could offsets the influence of top blockbusters. Then we visualized a case with median revenue(medium quality) and it had a lower revenue than the annual average from the same year as well as the monthly averages from previous and next years in all its genres, which indicates that movies with medium quality tend to be affect negatively by closely released top blockbusters.